

BT Group stock price prediction: Downward move continues as sellers dominate short-term trend

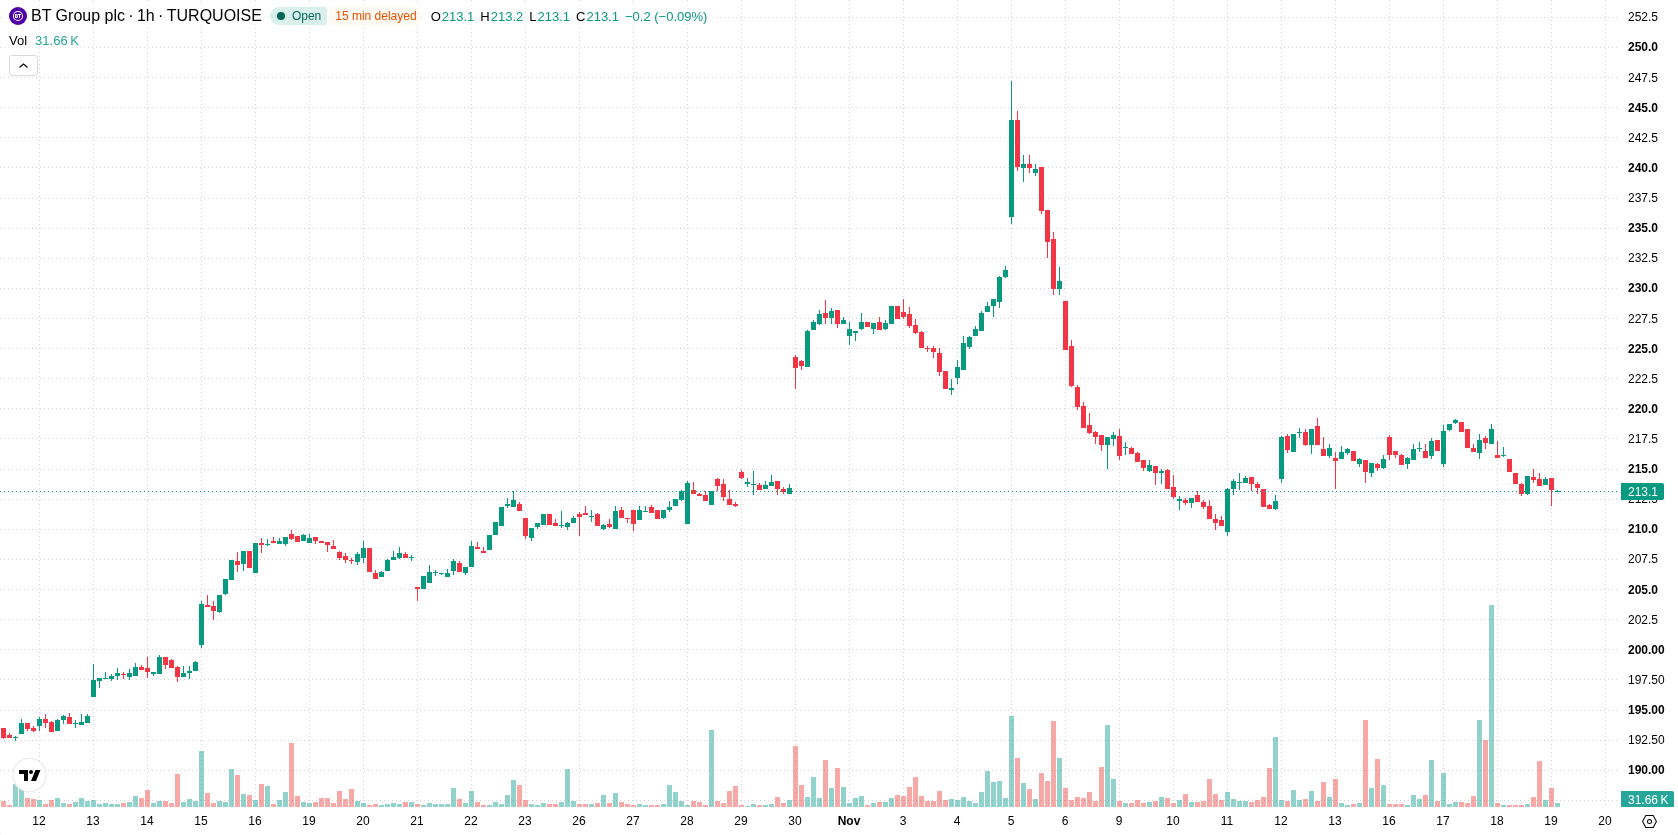
BT Group (BT-A) stock is trading at GBX214.1, down 1.65% today and near the session’s low amid subdued volatility. The price remains under short- and medium-term moving averages, while holding above a critical long-term average.
 214.50
219.10
Highlights
- Shares of BT Group trade below short- and medium-term moving averages but remain above long-term support at GBX206.78.
- Bearish momentum persists as MACD, ADX, and Bull/Bear Power indicate sellers control the intraday trend.
- Expected trading range for the next few days is GBX211.42 to GBX216.78, with a 32% chance of an upward move.
Bearish momentum extends as support holds above long-term average
On the technical front, BT-A trades below the H1 SMA-20 at GBX216.19 and the H1 SMA-50 at GBX215.95, while staying above the D1 SMA-200 at GBX206.78. Immediate resistance is defined by the Ichimoku Kijun at GBX215.85. Momentum remains bearish, with both MACD and ADX signaling continued downside. RSI and Stoch RSI are neutral, but CCI is in the oversold zone, suggesting possible selling exhaustion. Bull/Bear Power is negative at -0.71, confirming that sellers dominate in the intraday setting.
Downside risk prevails as range-bound volatility narrows outlook
Over the next few days, the price is expected to fluctuate within a typical volatility band between GBX211.42 and GBX216.78. There is a 32% probability of an upward move, making a continued decline more likely. The baseline scenario sees the price holding within this range. A break above resistance at GBX215.85–GBX216.78 could trigger a rebound, while a fall below GBX211.42 would point to further weakness.
Earlier, analysts noted that BT Group’s technical recovery was supported by stable operations and infrastructure investment despite broader macroeconomic challenges. The latest price action signals a shift toward increased downside risk, making GBX211.42 the key support level to monitor in the coming sessions.









-
 Afghanistan
-
 Albania
-
 Algeria
-
 Angola
-
 Argentina
-
 Armenia
-
 Australia
-
 Austria
-
 Azerbaijan
-
 Bahamas
-
 Bahrain
-
 Bangladesh
-
 Belarus
-
 Belgium
-
 Bolivia
-
 Botswana
-
 Brazil
-
 Brunei
-
 Bulgaria
-
 Cambodia
-
 Cameroon
-
 Canada
-
 Chile
-
 China
-
 Colombia
-
 Congo
-
 Costa Rica
-
 Cote d'Ivoire
-
 Croatia
-
 Cuba
-
 Cyprus
-
 Czechia
-
 DR Congo
-
 Denmark
-
 Dominican Republic
-
 Ecuador
-
 Egypt
-
 El Salvador
-
 Estonia
-
 Eswatini
-
 Ethiopia
-
 Finland
-
 France
-
 Georgia
-
 Germany
-
 Ghana
-
 Greece
-
 Haiti
-
 Hong Kong
-
 Hungary
-
 India
-
 Indonesia
-
 Iran, Islamic republic
-
 Iraq
-
 Ireland
-
 Israel
-
 Italy
-
 Jamaica
-
 Japan
-
 Jordan
-
 Kazakhstan
-
 Kenya
-
 Korea
-
 Kuwait
-
 Kyrgyzstan
-
 Laos
-
 Latvia
-
 Lebanon
-
 Lesotho
-
 Libya
-
 Lithuania
-
 Luxembourg
-
 Madagascar
-
 Malaysia
-
 Malta
-
 Mauritius
-
 Mexico
-
 Moldova
-
 Mongolia
-
 Montenegro
-
 Morocco
-
 Mozambique
-
 Myanmar
-
 Namibia
-
 Nepal
-
 Netherlands
-
 New Zealand
-
 Nigeria
-
 North Macedonia
-
 Norway
-
 Oman
-
 Pakistan
-
 Palestine
-
 Panama
-
 Papua New Guinea
-
 Paraguay
-
 Peru
-
 Philippines
-
 Poland
-
 Portugal
-
 Puerto Rico
-
 Qatar
-
 Reunion
-
 Romania
-
 Rwanda
-
 Saudi Arabia
-
 Serbia
-
 Singapore
-
 Slovakia
-
 Slovenia
-
 Somalia
-
 South Africa
-
 Spain
-
 Sri Lanka
-
 Sweden
-
 Switzerland
-
 Syria
-
 Taiwan
-
 Tajikistan
-
 Tanzania
-
 Thailand
-
 Trinidad and Tobago
-
 Tunisia
-
 Turkey
-
 UAE
-
 Uganda
-
 Ukraine
-
 United Kingdom
-
United States
-
 Uruguay
-
 Uzbekistan
-
 Venezuela
-
 Vietnam
-
 Yemen
-
 Zambia
-
 Zimbabwe
- Forex
- Crypto












