

BT-A holds steady as consolidation near key level caps further upside

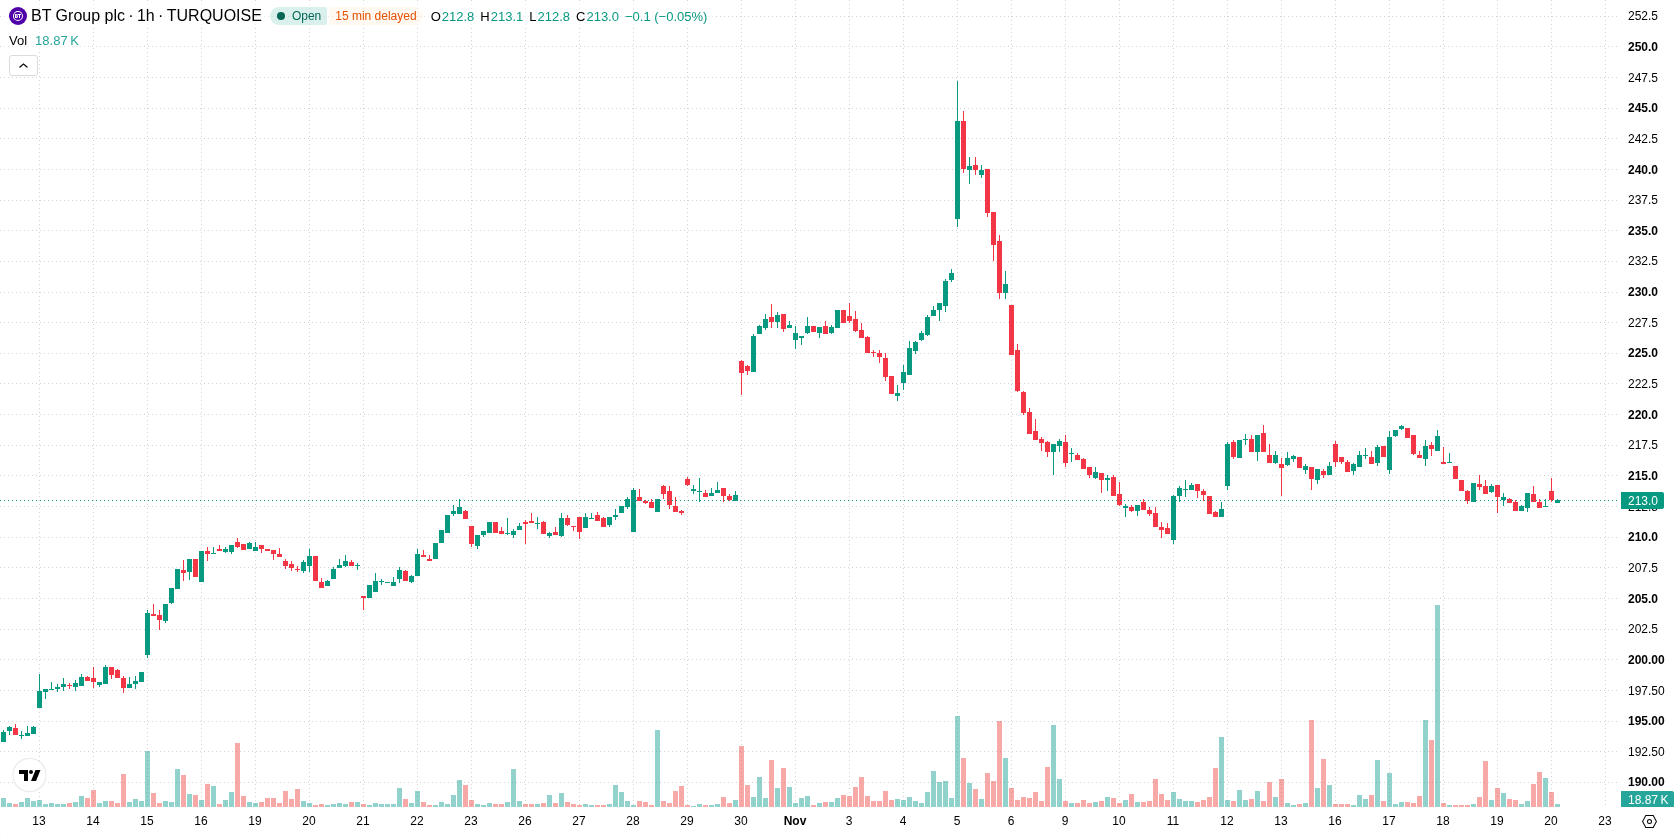
BT Group (BT-A) stock is trading at GBX212.5, marking a modest decline for the session. The price is currently positioned below its key short-term moving averages but remains above its longer-term trend levels.
 214.50
219.10
Highlights
- Shares of BT Group trade below short- and medium-term moving averages, reflecting ongoing seller pressure.
- MACD and ADX indicators remain in Sell mode while other oscillators are neutral with modest seller dominance intraday.
- BT Group shares are expected to range between GBX209.28 and GBX215.72 in the coming days, with a high probability of further downside.
Seller pressure builds as intraday resistance aligns with bearish momentum
On the hourly chart, the price is trading below the H1 SMA-20 at GBX214.05 and the H1 SMA-50 at GBX215.59, highlighting nearby intraday resistance levels. Longer-term, the price is still trading above the D1 SMA-200 at GBX206.82, representing structural support. The Ichimoku Kijun provides additional immediate resistance at GBX215.5. MACD and ADX both indicate sell conditions, while RSI, Stoch RSI, and CCI remain in neutral territories. Bull/Bear Power registers at -0.22, indicating light intraday seller dominance in a moderately volatile session.
High downside risk as consolidation persists within volatility band
Over the coming days, BT-A is expected to remain within the volatility band of GBX209.28 to GBX215.72. Downside probability is very high, while upside scenarios are limited in the current setup. An upward break above GBX215.5 would suggest the start of a recovery, but a decisive drop below GBX209.28 would likely accelerate seller momentum. The base case suggests the price is likely to consolidate within this established range barring a break of support or resistance.
Earlier, analysts noted that BT Group stock was exhibiting sustained downside momentum with sellers dominating the intraday setting. The latest price action reinforces this bearish outlook, making GBX209.28 a critical support level for traders to monitor in the days ahead.









-
 Afghanistan
-
 Albania
-
 Algeria
-
 Angola
-
 Argentina
-
 Armenia
-
 Australia
-
 Austria
-
 Azerbaijan
-
 Bahamas
-
 Bahrain
-
 Bangladesh
-
 Belarus
-
 Belgium
-
 Bolivia
-
 Botswana
-
 Brazil
-
 Brunei
-
 Bulgaria
-
 Cambodia
-
 Cameroon
-
 Canada
-
 Chile
-
 China
-
 Colombia
-
 Congo
-
 Costa Rica
-
 Cote d'Ivoire
-
 Croatia
-
 Cuba
-
 Cyprus
-
 Czechia
-
 DR Congo
-
 Denmark
-
 Dominican Republic
-
 Ecuador
-
 Egypt
-
 El Salvador
-
 Estonia
-
 Eswatini
-
 Ethiopia
-
 Finland
-
 France
-
 Georgia
-
 Germany
-
 Ghana
-
 Greece
-
 Haiti
-
 Hong Kong
-
 Hungary
-
 India
-
 Indonesia
-
 Iran, Islamic republic
-
 Iraq
-
 Ireland
-
 Israel
-
 Italy
-
 Jamaica
-
 Japan
-
 Jordan
-
 Kazakhstan
-
 Kenya
-
 Korea
-
 Kuwait
-
 Kyrgyzstan
-
 Laos
-
 Latvia
-
 Lebanon
-
 Lesotho
-
 Libya
-
 Lithuania
-
 Luxembourg
-
 Madagascar
-
 Malaysia
-
 Malta
-
 Mauritius
-
 Mexico
-
 Moldova
-
 Mongolia
-
 Montenegro
-
 Morocco
-
 Mozambique
-
 Myanmar
-
 Namibia
-
 Nepal
-
 Netherlands
-
 New Zealand
-
 Nigeria
-
 North Macedonia
-
 Norway
-
 Oman
-
 Pakistan
-
 Palestine
-
 Panama
-
 Papua New Guinea
-
 Paraguay
-
 Peru
-
 Philippines
-
 Poland
-
 Portugal
-
 Puerto Rico
-
 Qatar
-
 Reunion
-
 Romania
-
 Rwanda
-
 Saudi Arabia
-
 Serbia
-
 Singapore
-
 Slovakia
-
 Slovenia
-
 Somalia
-
 South Africa
-
 Spain
-
 Sri Lanka
-
 Sweden
-
 Switzerland
-
 Syria
-
 Taiwan
-
 Tajikistan
-
 Tanzania
-
 Thailand
-
 Trinidad and Tobago
-
 Tunisia
-
 Turkey
-
 UAE
-
 Uganda
-
 Ukraine
-
 United Kingdom
-
United States
-
 Uruguay
-
 Uzbekistan
-
 Venezuela
-
 Vietnam
-
 Yemen
-
 Zambia
-
 Zimbabwe
- Forex
- Crypto












