

JetBlue Airways shares technical analysis: Persistent downward momentum dominates near $3.32 support

JetBlue Airways (JBLU) stock is trading at $3.49, down 2.65% for the session. The price currently sits below its key moving averages, signaling persistent downward momentum over both shorter and longer timeframes.
 3.53
3.77
Highlights
- JetBlue Airways will launch two new daily nonstop international routes from Fort Lauderdale to Honduras and the Cayman Islands in February 2027.
- Additional flights to Grand Cayman, Tegucigalpa, and limited-time daily service to Port of Spain are planned for early 2027, aiming to broaden international revenue streams.
- Shares of JetBlue trade at $3.49 with persistent bearish momentum, projected to remain between $3.32 and $3.66 as technical indicators show sellers dominate.
International route expansion as revenue diversification amid selling pressure
JetBlue Airways has announced the launch of two new daily nonstop international routes from Fort Lauderdale-Hollywood International Airport to Comayagua, Honduras, and George Town, Cayman Islands, with flights beginning in February 2027, according to Gurufocus. These expansions mark a strategic move to broaden JetBlue's international presence, offering new destinations that could diversify the airline's revenue streams over time. Additionally, the airline will introduce flights to Grand Cayman and Tegucigalpa in late February 2027 and offer a limited-time daily service to Port of Spain in early 2027, according to TipRanks, which may incrementally boost seasonal demand though price action has remained under broader selling pressure.
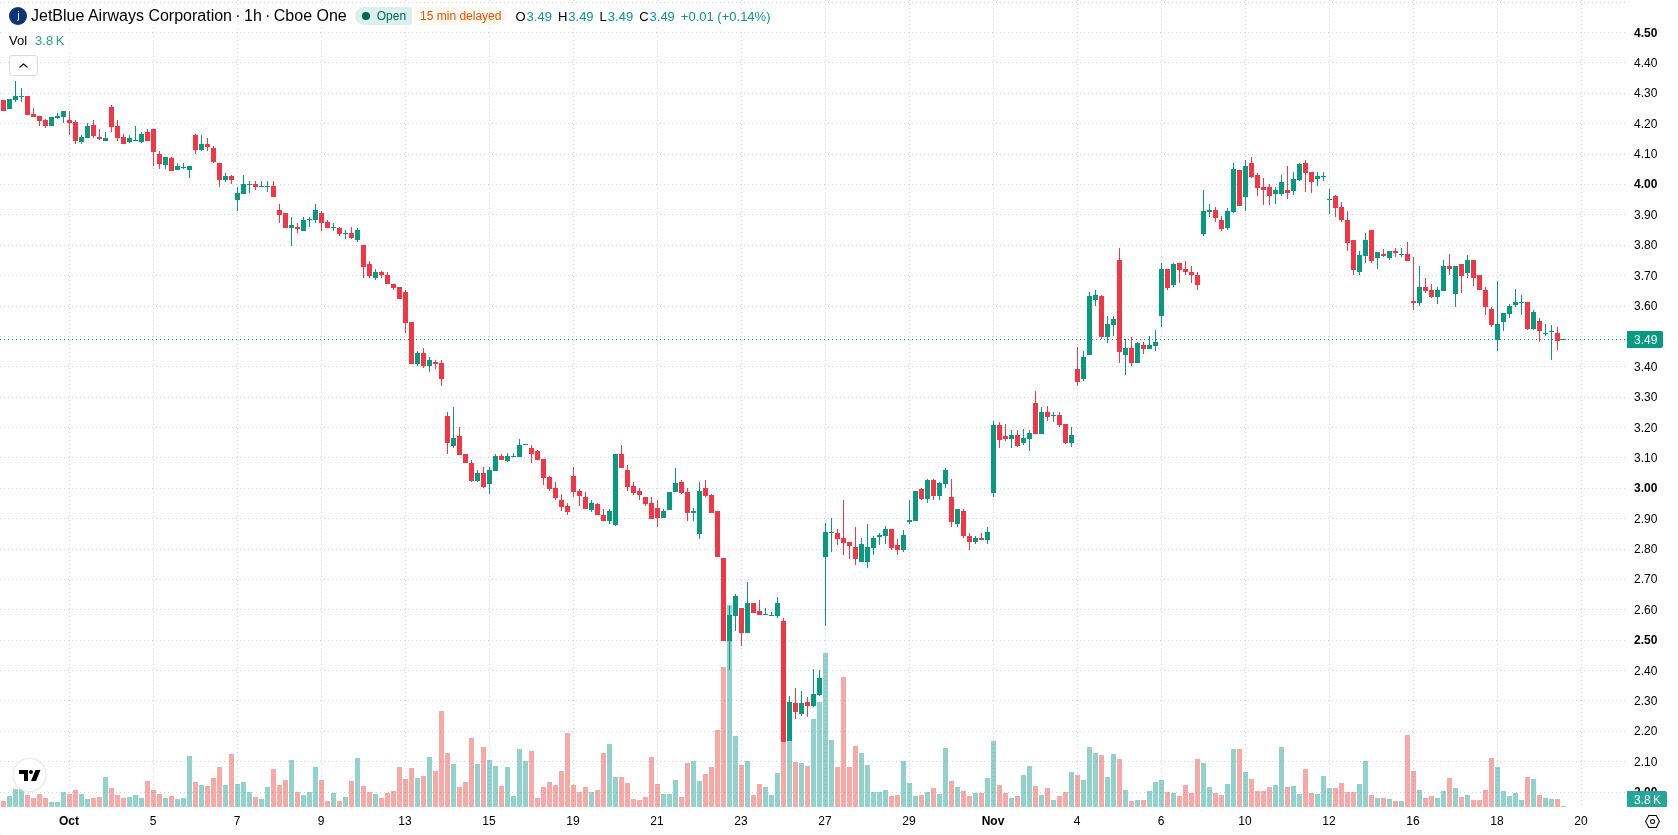
Bearish momentum confirmed as sellers control below key resistance
JBLU is trading below several key technical levels, with H1 SMA-20 at $3.63, H1 SMA-50 at $3.78, and D1 SMA-200 at $4.82 all positioned above the current price. The Ichimoku Kijun at $3.63 acts as immediate resistance. Momentum indicators confirm a bearish technical environment: both MACD and ADX signal a sell bias, while Bull/Bear Power is negative, indicating sellers dominate intraday trading. RSI is neutral, Stoch RSI and CCI are in the oversold zone—suggesting potential for selling exhaustion, but not an imminent reversal. The Awesome Oscillator is neutral and does not provide confirmation for the current momentum.
Further downside favored as low volatility limits rebound potential
Over the next several sessions, JBLU is expected to fluctuate between $3.32 and $3.66, tracking a volatility band relative to current levels. The likelihood of an upward move is very low, making a continuation to the downside the dominant scenario. Should the price remain within this band, the market could enter a choppy, sideways phase. A break above resistance at $3.63 would be necessary to signal a bullish reversal, while movement below $3.32 would confirm a fresh leg lower.
Earlier, analysts noted that JetBlue faced persistent financial and operational headwinds, with technical signals supporting a cautious outlook. The addition of new international routes adds a potential long-term growth catalyst, but near-term price action suggests traders should monitor $3.32 as a critical support level in the event of further downside.









-
 Afghanistan
-
 Albania
-
 Algeria
-
 Angola
-
 Argentina
-
 Armenia
-
 Australia
-
 Austria
-
 Azerbaijan
-
 Bahamas
-
 Bahrain
-
 Bangladesh
-
 Belarus
-
 Belgium
-
 Bolivia
-
 Botswana
-
 Brazil
-
 Brunei
-
 Bulgaria
-
 Cambodia
-
 Cameroon
-
 Canada
-
 Chile
-
 China
-
 Colombia
-
 Congo
-
 Costa Rica
-
 Cote d'Ivoire
-
 Croatia
-
 Cuba
-
 Cyprus
-
 Czechia
-
 DR Congo
-
 Denmark
-
 Dominican Republic
-
 Ecuador
-
 Egypt
-
 El Salvador
-
 Estonia
-
 Eswatini
-
 Ethiopia
-
 Finland
-
 France
-
 Georgia
-
 Germany
-
 Ghana
-
 Greece
-
 Haiti
-
 Hong Kong
-
 Hungary
-
 India
-
 Indonesia
-
 Iran, Islamic republic
-
 Iraq
-
 Ireland
-
 Israel
-
 Italy
-
 Jamaica
-
 Japan
-
 Jordan
-
 Kazakhstan
-
 Kenya
-
 Korea
-
 Kuwait
-
 Kyrgyzstan
-
 Laos
-
 Latvia
-
 Lebanon
-
 Lesotho
-
 Libya
-
 Lithuania
-
 Luxembourg
-
 Madagascar
-
 Malaysia
-
 Malta
-
 Mauritius
-
 Mexico
-
 Moldova
-
 Mongolia
-
 Montenegro
-
 Morocco
-
 Mozambique
-
 Myanmar
-
 Namibia
-
 Nepal
-
 Netherlands
-
 New Zealand
-
 Nigeria
-
 North Macedonia
-
 Norway
-
 Oman
-
 Pakistan
-
 Palestine
-
 Panama
-
 Papua New Guinea
-
 Paraguay
-
 Peru
-
 Philippines
-
 Poland
-
 Portugal
-
 Puerto Rico
-
 Qatar
-
 Reunion
-
 Romania
-
 Rwanda
-
 Saudi Arabia
-
 Serbia
-
 Singapore
-
 Slovakia
-
 Slovenia
-
 Somalia
-
 South Africa
-
 Spain
-
 Sri Lanka
-
 Sweden
-
 Switzerland
-
 Syria
-
 Taiwan
-
 Tajikistan
-
 Tanzania
-
 Thailand
-
 Trinidad and Tobago
-
 Tunisia
-
 Turkey
-
 UAE
-
 Uganda
-
 Ukraine
-
 United Kingdom
-
United States
-
 Uruguay
-
 Uzbekistan
-
 Venezuela
-
 Vietnam
-
 Yemen
-
 Zambia
-
 Zimbabwe
- Forex
- Crypto












