

Will JetBlue Airways stock avoid deeper losses as selling pressure persists?

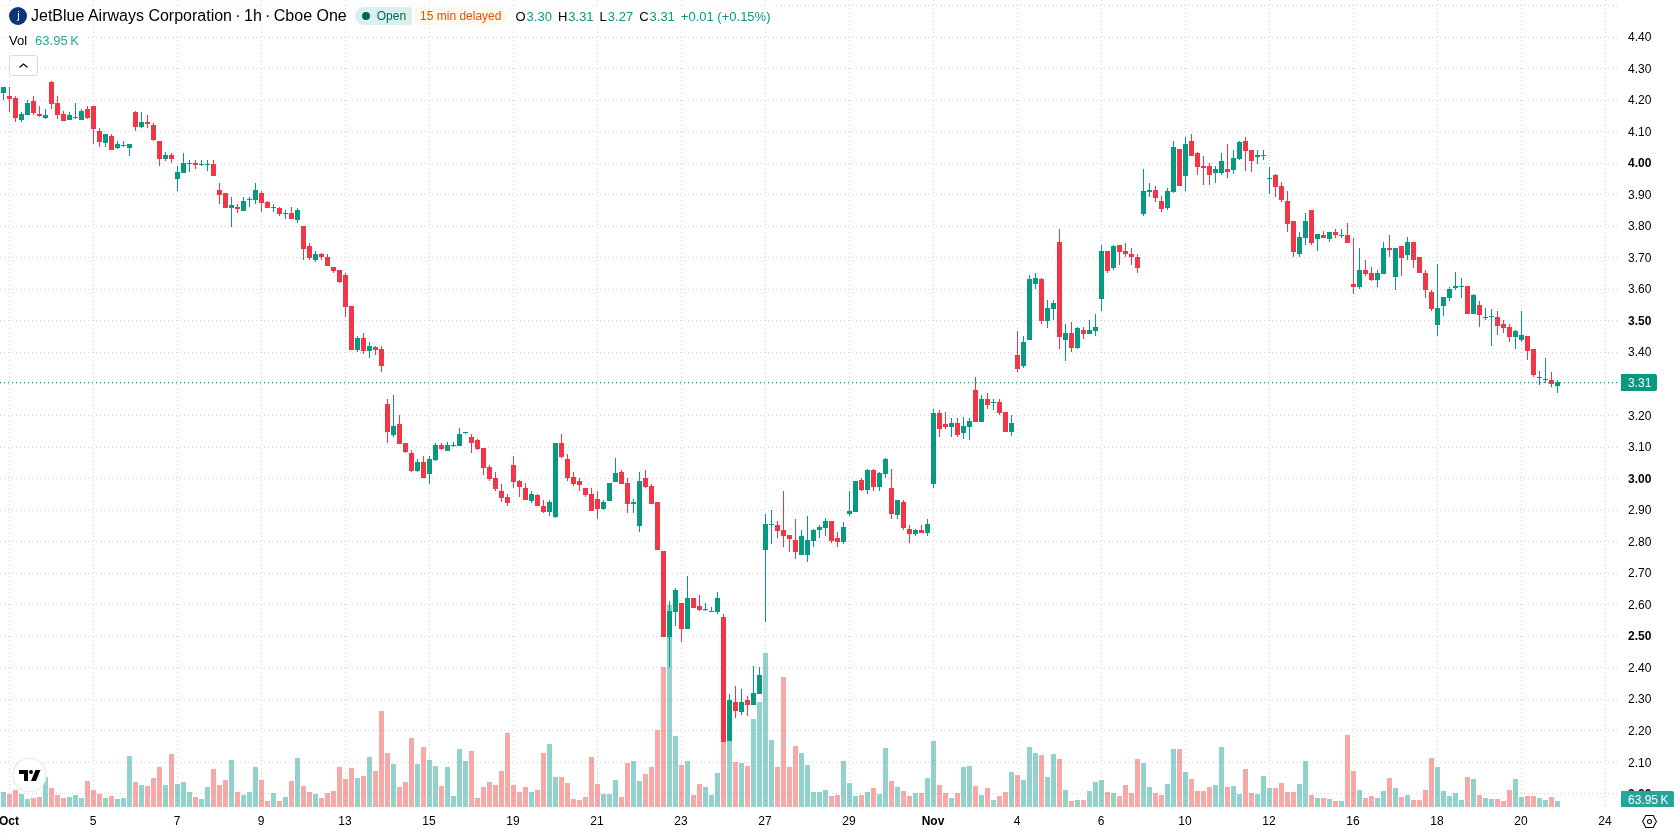
JetBlue Airways (JBLU) stock is trading at $3.29, down 5.05% on the day. The share price is currently sitting below its key moving averages, reflecting clear short-term and longer-term downward momentum.
 3.53
3.77
Highlights
- JetBlue Airways will add two new daily nonstop international flights from Fort Lauderdale to Honduras and the Cayman Islands, starting February 2027.
- This expansion aims to diversify JetBlue's international presence, with operational and revenue effects expected after launch.
- Shares of JetBlue fell 5.05% to $3.29, trading under key moving averages with high volatility and bearish momentum indicators pointing to a likely further decline toward $3.13 to $3.45.
Long lead time limits impact of new international route expansion
JetBlue Airways has announced plans to expand its international route network by launching two new daily nonstop flights from Fort Lauderdale-Hollywood International Airport to Comayagua, Honduras, and George Town, Cayman Islands, with service beginning in February 2027, according to Gurufocus. This strategic initiative is aimed at diversifying JetBlue's international footprint, but the expected operational and revenue benefits will only begin to materialize after the new routes commence. Market participants may view the long lead time to implementation as limiting the immediate impact of the news on the stock’s current trading, as price action has remained under broader selling pressure.
Oversold technicals and persistent resistance cap recovery prospects
Technically, JBLU is trading below the H1 SMA-20 at $3.54, the H1 SMA-50 at $3.70, and the D1 SMA-200 at $4.81. The Ichimoku Kijun on the hourly chart stands at $3.57, marking immediate resistance. Momentum indicators remain weak, as both MACD and ADX signal sell conditions. RSI, Stochastic RSI, and CCI readings are all in oversold territory, which points to potential near-term exhaustion in selling without guaranteeing a reversal. Bull/Bear Power is marginally negative at -0.04, highlighting seller dominance intraday, while the Awesome Oscillator is neutral.
Further downside likely amid weak momentum and resistance
In the short term, JBLU is likely to trade within a volatile band, fluctuating between $3.13 and $3.45. The likelihood of a sustained upward move is low given prevailing momentum and technical resistance, while a further decline remains much more probable. A baseline scenario sees the price moving within the established range, with a move above $3.57 necessary for any bullish reversal attempt. Conversely, a decisive break below $3.13 would further reinforce the existing downtrend.
Earlier, analysts noted that JetBlue's persistent downtrend was reinforced by bearish technical signals, with new international route expansions seen as potential long-term catalysts rather than near-term supports. The current analysis affirms this view, highlighting ongoing selling pressure and suggesting that traders should closely monitor $3.13 as a pivotal level for confirming further downside risk.









-
 Afghanistan
-
 Albania
-
 Algeria
-
 Angola
-
 Argentina
-
 Armenia
-
 Australia
-
 Austria
-
 Azerbaijan
-
 Bahamas
-
 Bahrain
-
 Bangladesh
-
 Belarus
-
 Belgium
-
 Bolivia
-
 Botswana
-
 Brazil
-
 Brunei
-
 Bulgaria
-
 Cambodia
-
 Cameroon
-
 Canada
-
 Chile
-
 China
-
 Colombia
-
 Congo
-
 Costa Rica
-
 Cote d'Ivoire
-
 Croatia
-
 Cuba
-
 Cyprus
-
 Czechia
-
 DR Congo
-
 Denmark
-
 Dominican Republic
-
 Ecuador
-
 Egypt
-
 El Salvador
-
 Estonia
-
 Eswatini
-
 Ethiopia
-
 Finland
-
 France
-
 Georgia
-
 Germany
-
 Ghana
-
 Greece
-
 Haiti
-
 Hong Kong
-
 Hungary
-
 India
-
 Indonesia
-
 Iran, Islamic republic
-
 Iraq
-
 Ireland
-
 Israel
-
 Italy
-
 Jamaica
-
 Japan
-
 Jordan
-
 Kazakhstan
-
 Kenya
-
 Korea
-
 Kuwait
-
 Kyrgyzstan
-
 Laos
-
 Latvia
-
 Lebanon
-
 Lesotho
-
 Libya
-
 Lithuania
-
 Luxembourg
-
 Madagascar
-
 Malaysia
-
 Malta
-
 Mauritius
-
 Mexico
-
 Moldova
-
 Mongolia
-
 Montenegro
-
 Morocco
-
 Mozambique
-
 Myanmar
-
 Namibia
-
 Nepal
-
 Netherlands
-
 New Zealand
-
 Nigeria
-
 North Macedonia
-
 Norway
-
 Oman
-
 Pakistan
-
 Palestine
-
 Panama
-
 Papua New Guinea
-
 Paraguay
-
 Peru
-
 Philippines
-
 Poland
-
 Portugal
-
 Puerto Rico
-
 Qatar
-
 Reunion
-
 Romania
-
 Rwanda
-
 Saudi Arabia
-
 Serbia
-
 Singapore
-
 Slovakia
-
 Slovenia
-
 Somalia
-
 South Africa
-
 Spain
-
 Sri Lanka
-
 Sweden
-
 Switzerland
-
 Syria
-
 Taiwan
-
 Tajikistan
-
 Tanzania
-
 Thailand
-
 Trinidad and Tobago
-
 Tunisia
-
 Turkey
-
 UAE
-
 Uganda
-
 Ukraine
-
 United Kingdom
-
United States
-
 Uruguay
-
 Uzbekistan
-
 Venezuela
-
 Vietnam
-
 Yemen
-
 Zambia
-
 Zimbabwe
- Forex
- Crypto












