

Shell stock outlook: Mixed momentum signals and stiff resistance at GBX3,633

Shell (SHEL) stock is trading at GBX3,576, reflecting a slight move lower on the day. The price is currently positioned below its key short- and medium-term moving averages, but remains above the long-term average.
 3605.00
3752.00
Highlights
- Shell completed a share buyback for cancellation, directly reducing outstanding shares and enhancing earnings per share metrics.
- The ongoing buyback program affirms Shell's intent to return capital to shareholders and improve capital efficiency.
- Shell stock trades below short- and medium-term technical indicators with momentum signals bearish, and the projected range is GBX3,489 to GBX3,662 with high probability of further declines.
Share cancellation supports share price as buyback advances
Shell plc completed a share purchase for cancellation on November 18, 2026, as part of its ongoing buyback program, according to Globenewswire. This action directly reduces the number of outstanding shares, which can increase measures like earnings per share and support the share price through improved capital efficiency. The buyback also signals continued commitment to returning capital to shareholders, adding to the fundamental backdrop for the stock.
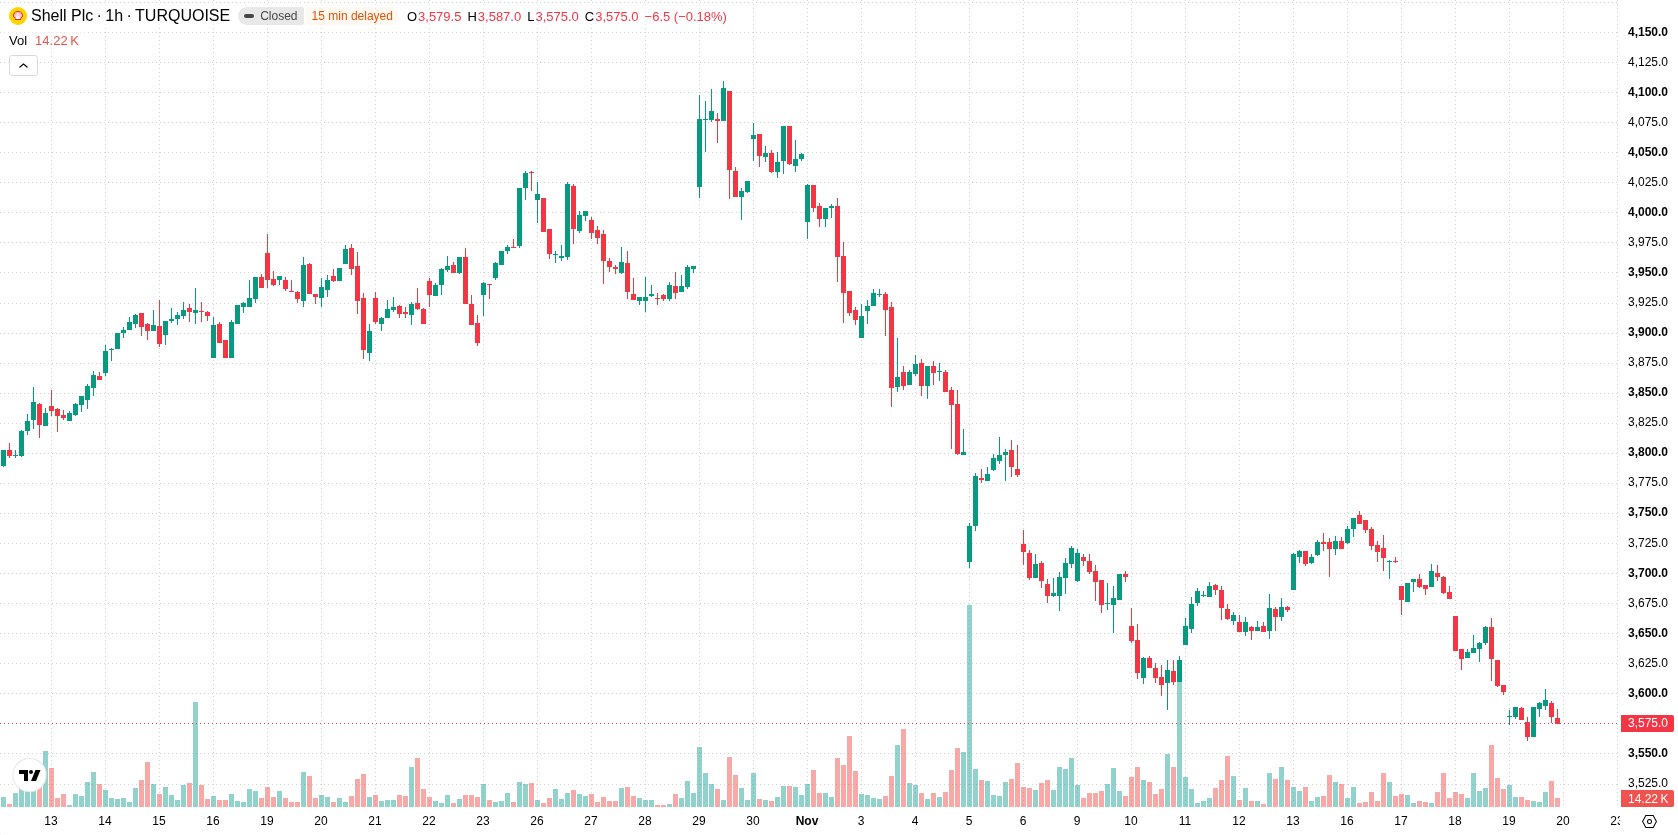
Bearish momentum with resistance capping mixed technical outlook
On the technical front, SHEL is trading below the H1 SMA-20 at GBX3,614 and the H1 SMA-50 at GBX3,669, but remains above the D1 SMA-200 at GBX3,347. The Ichimoku Kijun at GBX3,633 sets an immediate resistance level. Momentum indicators skew bearish: MACD shows Strong Sell and ADX signals a Sell, while Bull/Bear Power is negative, highlighting intraday seller dominance. RSI, Stoch RSI, CCI, and the Awesome Oscillator all give neutral readings, indicating neither oversold nor overbought conditions and contributing to a mixed technical profile.
Further downside risk as rebound chances remain limited
Over the next several trading days, SHEL is expected to move within a volatility band between GBX3,489 and GBX3,662. The probability of an upward breakout is very low, while the likelihood of a move lower remains high, making a rebound much less likely than further downside. The baseline scenario favors sideways trading within this corridor, with a bullish scenario requiring a break above immediate resistance and further decline likely if prices fall below the projected support.
Earlier, analysts noted that Shell remained vulnerable to further downside due to persistent macroeconomic risks and sustained selling pressure. The current technical setup, combined with continued buyback activity, adds a nuanced layer to the outlook, making the lower end of the projected volatility band a critical support to monitor in the days ahead.









-
 Afghanistan
-
 Albania
-
 Algeria
-
 Angola
-
 Argentina
-
 Armenia
-
 Australia
-
 Austria
-
 Azerbaijan
-
 Bahamas
-
 Bahrain
-
 Bangladesh
-
 Belarus
-
 Belgium
-
 Bolivia
-
 Botswana
-
 Brazil
-
 Brunei
-
 Bulgaria
-
 Cambodia
-
 Cameroon
-
 Canada
-
 Chile
-
 China
-
 Colombia
-
 Congo
-
 Costa Rica
-
 Cote d'Ivoire
-
 Croatia
-
 Cuba
-
 Cyprus
-
 Czechia
-
 DR Congo
-
 Denmark
-
 Dominican Republic
-
 Ecuador
-
 Egypt
-
 El Salvador
-
 Estonia
-
 Eswatini
-
 Ethiopia
-
 Finland
-
 France
-
 Georgia
-
 Germany
-
 Ghana
-
 Greece
-
 Haiti
-
 Hong Kong
-
 Hungary
-
 India
-
 Indonesia
-
 Iran, Islamic republic
-
 Iraq
-
 Ireland
-
 Israel
-
 Italy
-
 Jamaica
-
 Japan
-
 Jordan
-
 Kazakhstan
-
 Kenya
-
 Korea
-
 Kuwait
-
 Kyrgyzstan
-
 Laos
-
 Latvia
-
 Lebanon
-
 Lesotho
-
 Libya
-
 Lithuania
-
 Luxembourg
-
 Madagascar
-
 Malaysia
-
 Malta
-
 Mauritius
-
 Mexico
-
 Moldova
-
 Mongolia
-
 Montenegro
-
 Morocco
-
 Mozambique
-
 Myanmar
-
 Namibia
-
 Nepal
-
 Netherlands
-
 New Zealand
-
 Nigeria
-
 North Macedonia
-
 Norway
-
 Oman
-
 Pakistan
-
 Palestine
-
 Panama
-
 Papua New Guinea
-
 Paraguay
-
 Peru
-
 Philippines
-
 Poland
-
 Portugal
-
 Puerto Rico
-
 Qatar
-
 Reunion
-
 Romania
-
 Rwanda
-
 Saudi Arabia
-
 Serbia
-
 Singapore
-
 Slovakia
-
 Slovenia
-
 Somalia
-
 South Africa
-
 Spain
-
 Sri Lanka
-
 Sweden
-
 Switzerland
-
 Syria
-
 Taiwan
-
 Tajikistan
-
 Tanzania
-
 Thailand
-
 Trinidad and Tobago
-
 Tunisia
-
 Turkey
-
 UAE
-
 Uganda
-
 Ukraine
-
 United Kingdom
-
United States
-
 Uruguay
-
 Uzbekistan
-
 Venezuela
-
 Vietnam
-
 Yemen
-
 Zambia
-
 Zimbabwe
- Forex
- Crypto












