

Will National Grid stock avoid deeper losses amid consolidation near GBX1,239 resistance?

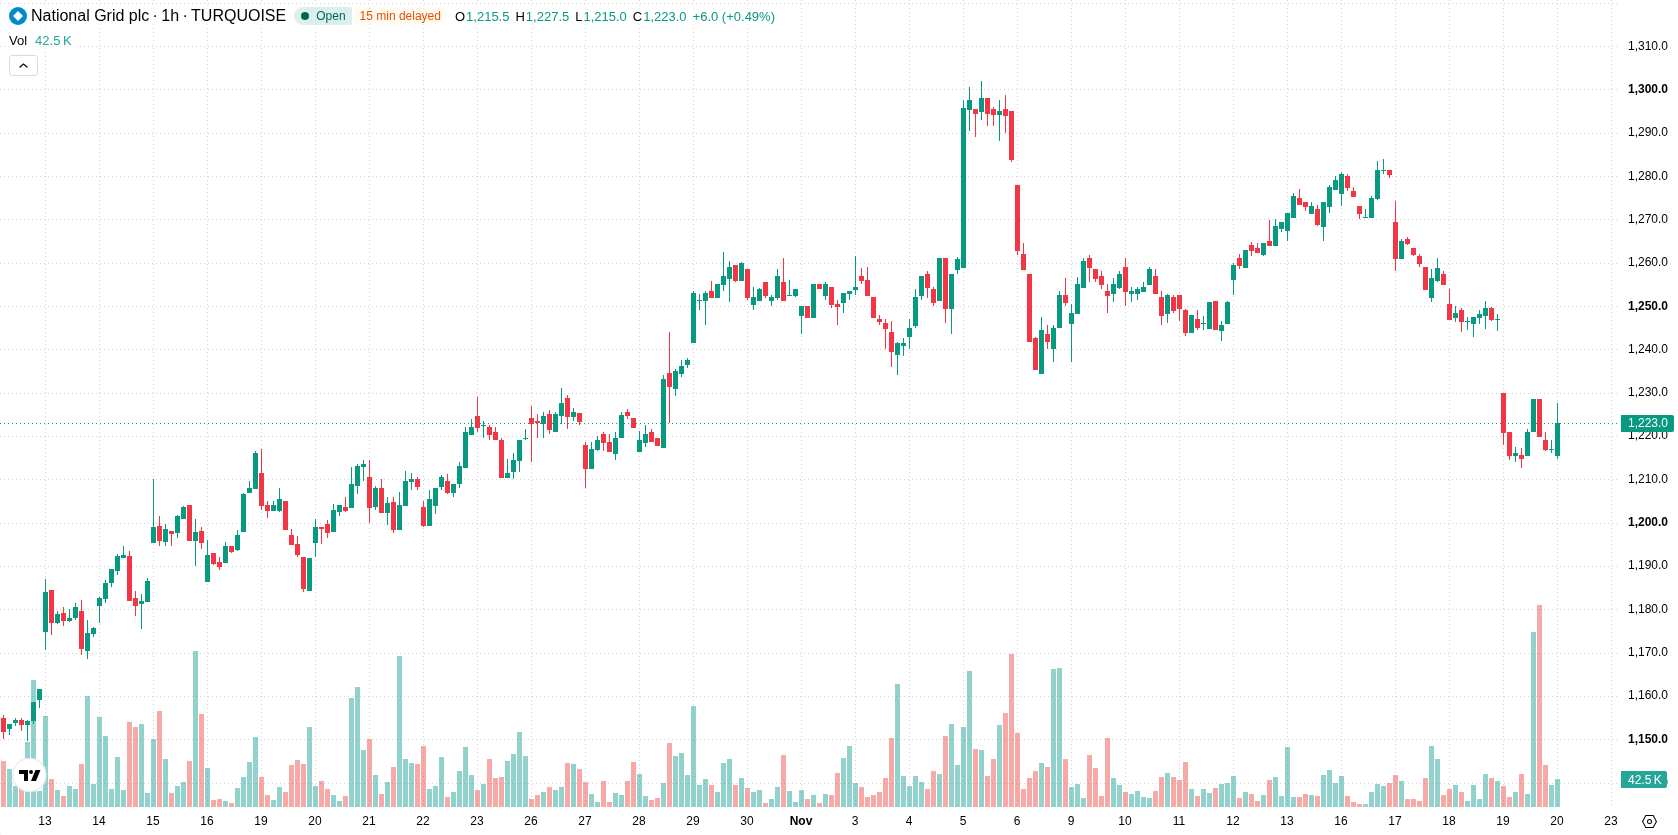
National Grid (NG) stock is trading at GBX1,220 after a modest rise in the latest session. The price continues to hold below its key moving averages, suggesting ongoing weak momentum.
 1231.50
1284.50
Highlights
- National Grid publicly rejected online rumors of a UK blackout, confirming uninterrupted grid stability and operational assurance.
- By openly addressing misinformation, National Grid reduced potential market anxiety and reinforced confidence in reliable service continuity.
- Shares of National Grid remain under seller pressure with negative momentum, trading below key moving averages and forecast to consolidate between GBX1,187 and GBX1,252 in the next 2 to 3 trading days.
Market stability as National Grid quells false blackout claims
National Grid has publicly rejected the credibility of a viral post that falsely claimed the UK would face a major blackout, according to Ladbible. By directly refuting these rumors, the company mitigates potential market anxiety and reassures both investors and consumers about the stability of its operations. This response helps prevent unwarranted volatility, supporting a stable sentiment in the absence of genuine operational disruptions.
Mixed momentum and resistance cap upside amid technical caution
On the technical front, NG remains below H1 SMA-20 at GBX1,233, H1 SMA-50 at GBX1,255, and D1 SMA-200 at GBX1,240, with the Ichimoku Kijun on the D1 timeframe at GBX1,239 serving as immediate resistance. Momentum indicators are largely negative—MACD shows a strong sell, and ADX indicates a sell bias. RSI and CCI readings are neutral, while Stochastic RSI is overbought, signaling possible short-term overheating. Bull/Bear Power is just above zero at 0.63, indicating only marginal intraday buyer dominance, and the Awesome Oscillator remains neutral. These mixed technical signals, together with subdued price volatility, suggest caution as upside potential is limited and downside risks persist.
Downside risk elevated as higher move seen unlikely short term
Over the next 2–3 trading days, price action is expected to stay within a volatility band from GBX1,187 to GBX1,252. The likelihood of a move higher is limited at just 30%, so a downward scenario is considerably more probable. The baseline scenario calls for continued sideways consolidation within this range, while a bullish outcome would require a decisive breakout above resistance near the Ichimoku Kijun and relevant SMAs. Conversely, a failure to hold at the lower band could open the way for further losses.
Earlier, analysts noted that persistent bearish momentum and prevailing negative signals suggested National Grid shares were likely to remain under pressure. The current technical outlook reinforces this sideways-to-downside bias, with the key risk now being a breakdown below GBX1,187 that could trigger further losses.






Latest National Grid News




-
 Afghanistan
-
 Albania
-
 Algeria
-
 Angola
-
 Argentina
-
 Armenia
-
 Australia
-
 Austria
-
 Azerbaijan
-
 Bahamas
-
 Bahrain
-
 Bangladesh
-
 Belarus
-
 Belgium
-
 Bolivia
-
 Botswana
-
 Brazil
-
 Brunei
-
 Bulgaria
-
 Cambodia
-
 Cameroon
-
 Canada
-
 Chile
-
 China
-
 Colombia
-
 Congo
-
 Costa Rica
-
 Cote d'Ivoire
-
 Croatia
-
 Cuba
-
 Cyprus
-
 Czechia
-
 DR Congo
-
 Denmark
-
 Dominican Republic
-
 Ecuador
-
 Egypt
-
 El Salvador
-
 Estonia
-
 Eswatini
-
 Ethiopia
-
 Finland
-
 France
-
 Georgia
-
 Germany
-
 Ghana
-
 Greece
-
 Haiti
-
 Hong Kong
-
 Hungary
-
 India
-
 Indonesia
-
 Iran, Islamic republic
-
 Iraq
-
 Ireland
-
 Israel
-
 Italy
-
 Jamaica
-
 Japan
-
 Jordan
-
 Kazakhstan
-
 Kenya
-
 Korea
-
 Kuwait
-
 Kyrgyzstan
-
 Laos
-
 Latvia
-
 Lebanon
-
 Lesotho
-
 Libya
-
 Lithuania
-
 Luxembourg
-
 Madagascar
-
 Malaysia
-
 Malta
-
 Mauritius
-
 Mexico
-
 Moldova
-
 Mongolia
-
 Montenegro
-
 Morocco
-
 Mozambique
-
 Myanmar
-
 Namibia
-
 Nepal
-
 Netherlands
-
 New Zealand
-
 Nigeria
-
 North Macedonia
-
 Norway
-
 Oman
-
 Pakistan
-
 Palestine
-
 Panama
-
 Papua New Guinea
-
 Paraguay
-
 Peru
-
 Philippines
-
 Poland
-
 Portugal
-
 Puerto Rico
-
 Qatar
-
 Reunion
-
 Romania
-
 Rwanda
-
 Saudi Arabia
-
 Serbia
-
 Singapore
-
 Slovakia
-
 Slovenia
-
 Somalia
-
 South Africa
-
 Spain
-
 Sri Lanka
-
 Sweden
-
 Switzerland
-
 Syria
-
 Taiwan
-
 Tajikistan
-
 Tanzania
-
 Thailand
-
 Trinidad and Tobago
-
 Tunisia
-
 Turkey
-
 UAE
-
 Uganda
-
 Ukraine
-
 United Kingdom
-
United States
-
 Uruguay
-
 Uzbekistan
-
 Venezuela
-
 Vietnam
-
 Yemen
-
 Zambia
-
 Zimbabwe
- Forex
- Crypto












