Best Price Action Techniques For Binary Trading


Editorial Note: While we adhere to strict Editorial Integrity, this post may contain references to products from our partners. Here's an explanation for How We Make Money. None of the data and information on this webpage constitutes investment advice according to our Disclaimer.
The best price action techniques for binary trading are:
Understanding and interpreting price movements can be the key differentiator between profitable and unprofitable trades. In this article, we will look at some of the best price action techniques for binary trading and delve into the process of reading charts, recognizing patterns, and understanding market sentiment.
Best price action candlesticks and patterns in binary trading
Bullish engulfing
This pattern signifies a shift in momentum from bearish to bullish. It occurs when a small bearish candle is followed by a larger bullish candle that completely engulfs the previous one. Traders interpret this as a potential upward reversal.

Bearish engulfing
In contrast to the bullish engulfing pattern, the bearish engulfing pattern suggests a potential reversal from bullish to bearish. It occurs when a small bullish candle is followed by a larger bearish candle that engulfs the previous bullish candle.

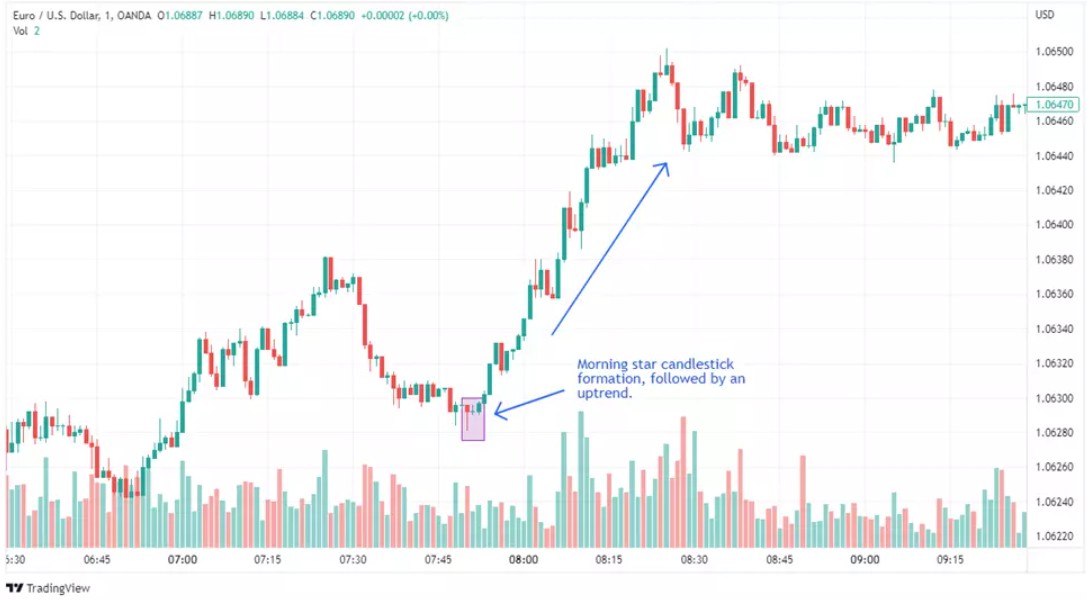
Morning star
The morning star is a bullish reversal pattern that emerges after a downtrend. It consists of three candles – a long bearish candle, a small candle that gaps down, and a long bullish candle that gaps up. This pattern indicates a potential reversal of the downtrend.
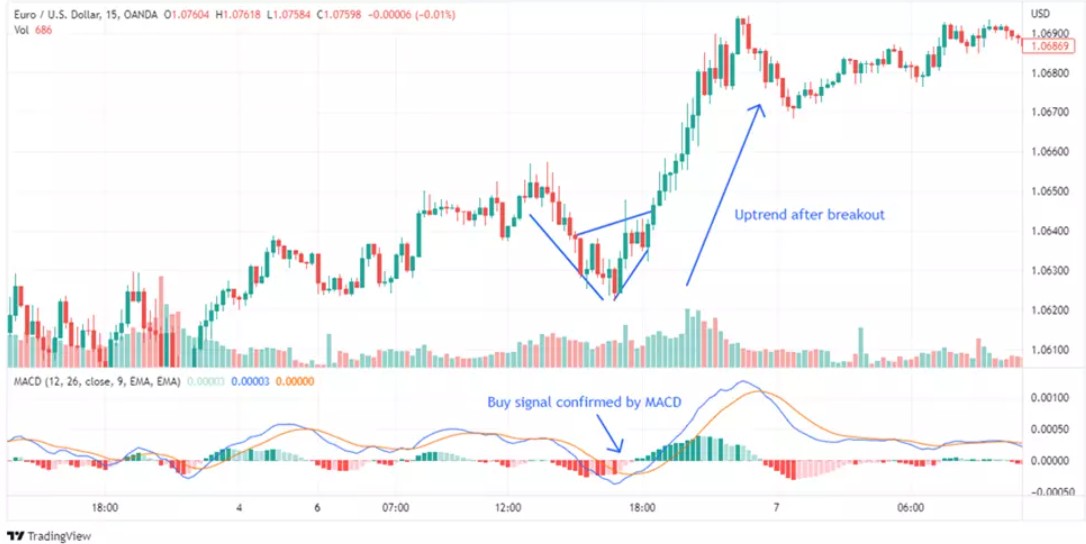
Ascending triangle
The ascending triangle is a bullish continuation pattern. It forms when the price creates higher lows, testing a resistance level multiple times. Traders interpret this pattern as a potential signal for the continuation of an upward trend.
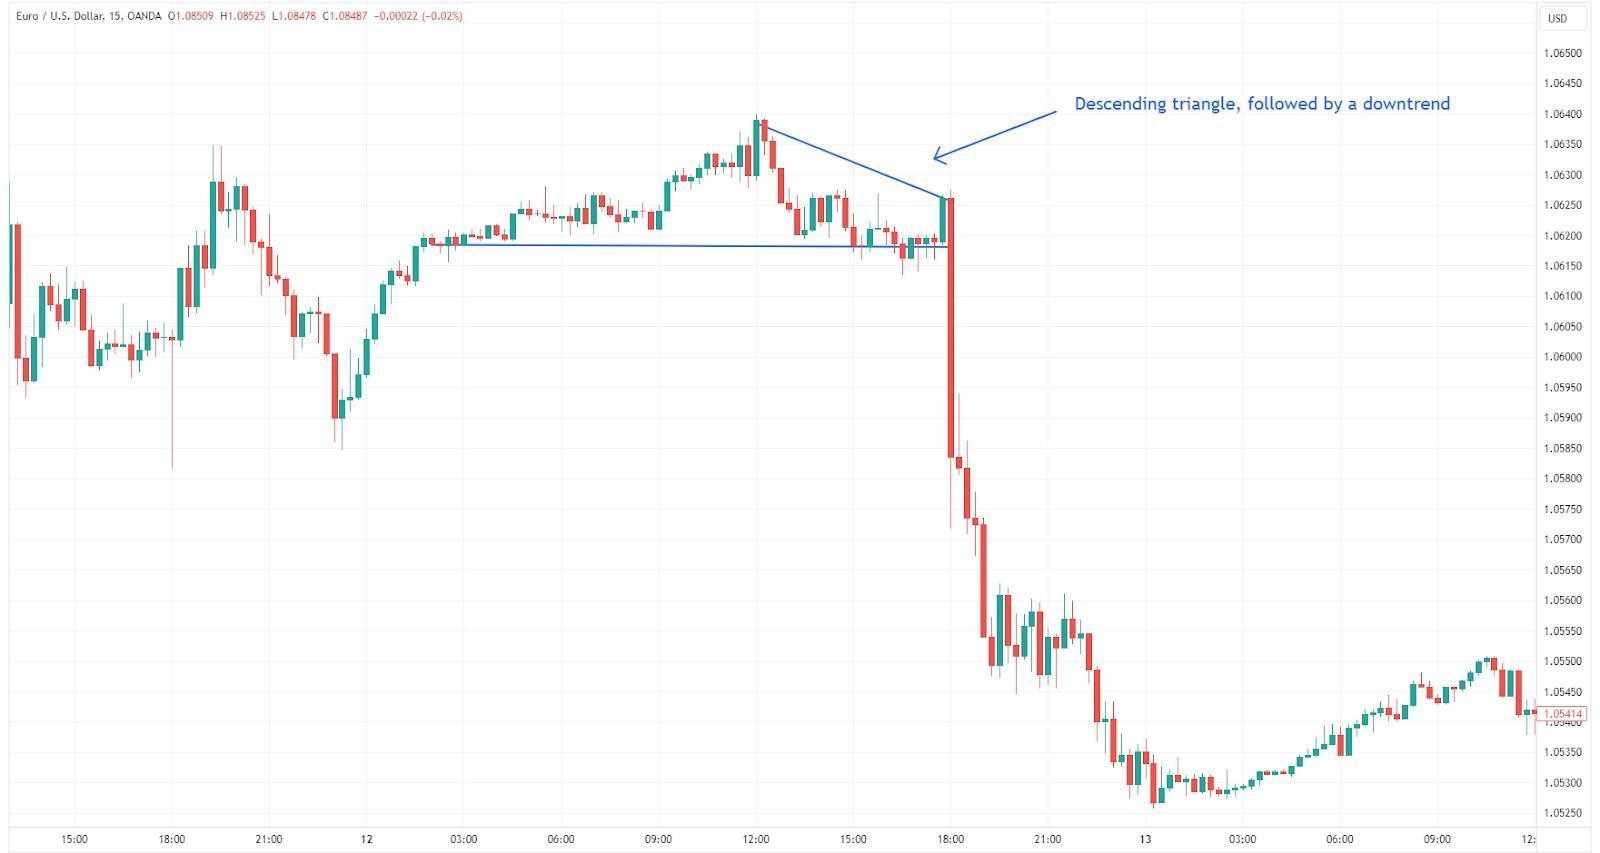
Descending triangle
The descending triangle is a bearish continuation pattern. It occurs when the price forms lower highs, testing a support level multiple times. Traders look at this pattern as a potential signal for the continuation of a downward trend.
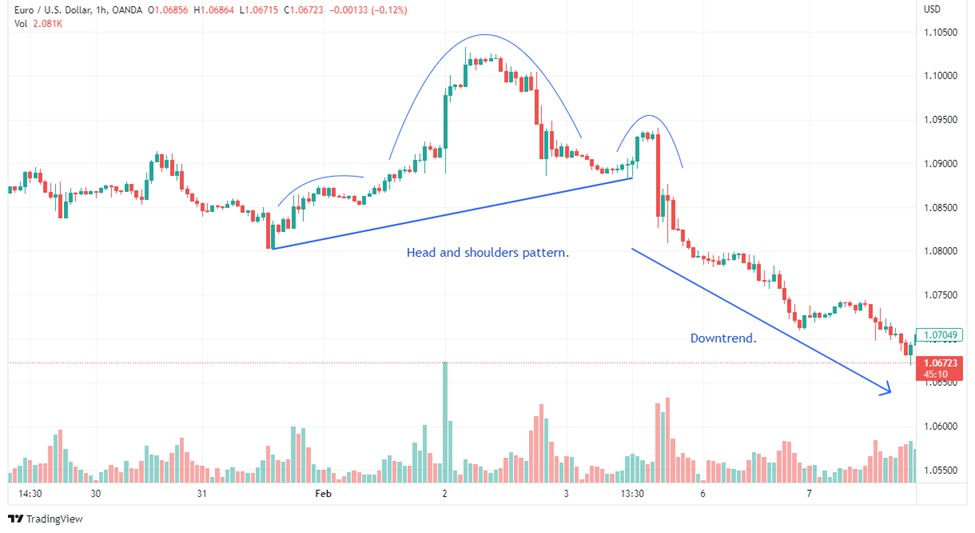
Head and shoulders
The head and shoulders pattern is a bearish reversal formation. It typically occurs after an uptrend and consists of three peaks, with the middle peak being the highest. A neckline connects the lows between the peaks, suggesting a potential trend reversal.
Pin bar
This strategy is based on identifying pin bars, which are candlesticks with a small body and a long wick. Pin bars can indicate a potential reversal in the market.

Inside bar
This strategy is based on identifying inside bars, which are candlesticks that are completely contained within the range of the previous candlestick. Inside bars can indicate a potential breakout or reversal in the market.

| Candlestick Pattern | Significance |
|---|---|
| Bullish engulfing | Indicates a potential reversal from a downtrend to an uptrend. It occurs when a bullish candle fully engulfs the previous bearish candle. |
| Bearish engulfing | Suggests a potential reversal from an uptrend to a downtrend. It occurs when a bearish candle fully engulfs the preceding bullish candle. |
| Morning star | Signals a potential bullish reversal. It consists of three candles - a long bearish candle, a small bullish or bearish gap, and a long bullish candle. |
| Ascending triangle | A continuation pattern that suggests the potential continuation of an existing uptrend. It forms as higher lows converge towards a horizontal resistance line. |
| Descending triangle | A continuation pattern indicating the potential continuation of a downtrend. It forms as lower highs converge towards a horizontal support line. |
| Head and shoulders | A reversal pattern indicating a potential trend change. It consists of three peaks - a higher peak (head) between two lower peaks (shoulders). |
| Pin bar | Signifies a potential reversal in price direction. It has a small body and a long wick, indicating a rejection of higher or lower prices by the market. |
| Inside bar | Represents a period of consolidation or indecision in the market. It occurs when the current candle's range is within the high and low of the previous candle. |
What is a price action strategy?
A price action strategy in binary options trading is a methodology that enables traders to analyze and interpret the market by closely observing recent and real price movements.
For instance, if a trader using a price action strategy observes a consistent upward movement in an asset's price, they may interpret this as a bullish trend. This observation becomes a crucial factor in their decision-making process, allowing for more nuanced and context-specific trading choices.
Importance of price action strategies
Price action strategies hold significance in binary options trading due to their capacity to help traders make well-informed decisions based on real-time market conditions. Here are the important points to keep in mind while using price action strategies in binary trading:
Focus on key candlestick patterns for confirmation. Pay attention to key candlestick patterns like pin bars and engulfing candles. They work best when they form near important price levels like support or resistance, helping you filter out bad signals.
Combine price action with time-frame analysis. Check different time-frames to confirm price action setups. For example, if a bullish engulfing candle forms on a 15-minute chart, make sure the 1-hour chart also shows a bullish trend. Using multiple charts helps you trade more accurately and with less risk.
Monitor fakeouts near significant price levels. Spot fakeouts by seeing how price behaves around key levels before jumping in. For instance, wait for the price to retest a broken level to confirm the move and avoid being trapped.
Trade with momentum-driven price action. Focus on clear, strong price moves that don’t have too many pullbacks. Pair this with a volume indicator to ensure the move has enough market support. This makes your trades more dependable.
What is the importance of price action confirmation?
Price action confirmation enhances the accuracy of trading decisions by using additional indicators to validate trends, breakouts, or reversals. This reduces false signals and improves risk management. However, no confirmation signal guarantees accuracy, as markets are dynamic and influenced by unexpected events. Traders should combine confirmations with a robust overall strategy, staying aware of biases like confirmation bias, to adapt to changing conditions and safeguard their capital.
How can price action indicators help in identifying price patterns?
The utilization of indicators enhances a trader's ability to recognize potential entry and exit points, thereby contributing to the overall effectiveness of their trading strategy.
Price action indicators serve as dynamic tools that offer insights into the market's behavior. They contribute to the identification of various price patterns, enabling traders to discern trends and potential reversals. Through visual cues, these indicators facilitate a clearer understanding of the market conditions, allowing traders to adapt their strategies accordingly.
Best price action indicators
Moving averages
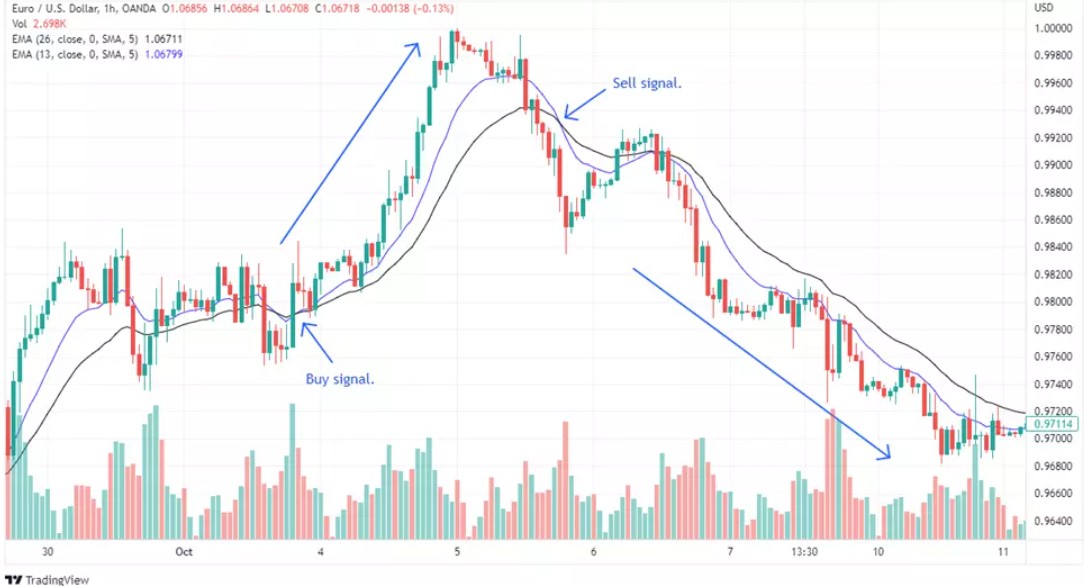
Moving averages are foundational indicators used to determine the trend direction and smoothen out price fluctuations. By calculating the average price of an asset over a specific period, moving averages provide a visual representation of the overall trend. Traders leverage this information to identify the prevailing market direction and potential trend changes.
MACD (Moving Average Convergence Divergence)
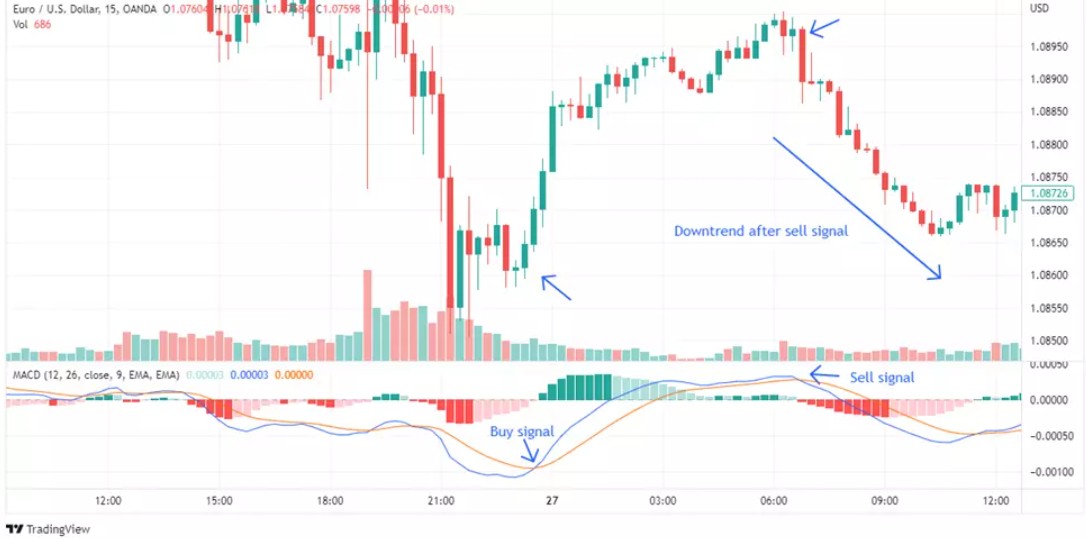
MACD is a versatile indicator employed to identify shifts in momentum and trend direction. Comprising two moving averages - a fast one and a slow one - along with a histogram representing the difference between them, MACD offers a comprehensive view of trend dynamics. Traders interpret the MACD signals to gauge potential trend reversals or continuations.
RSI (Relative Strength Index)
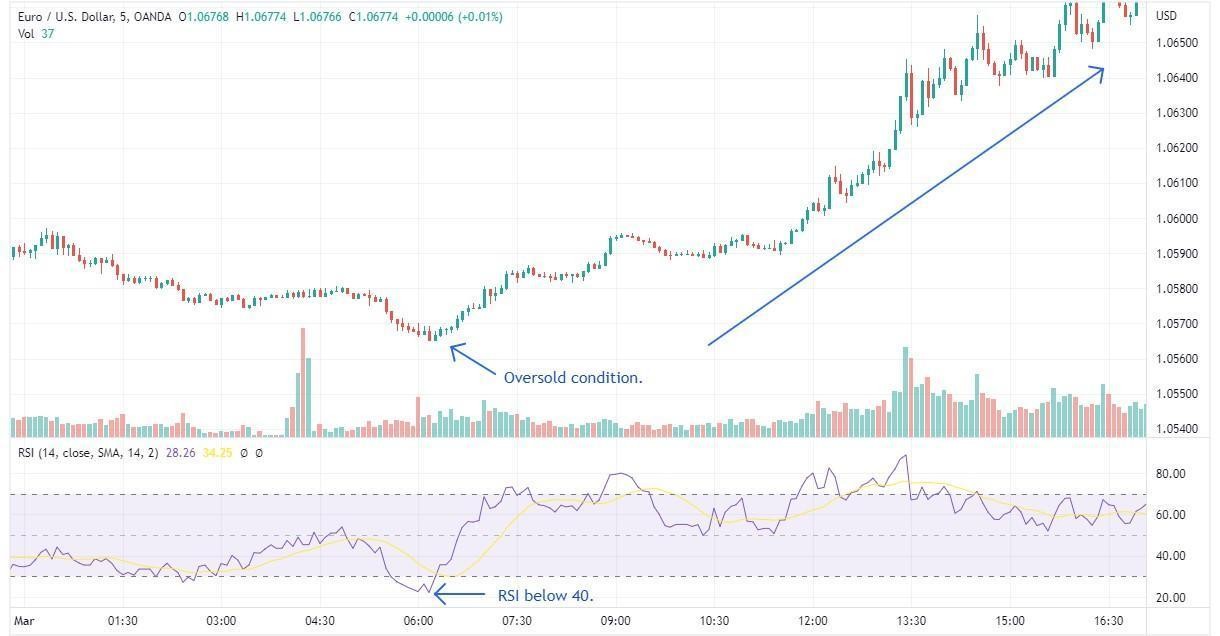
RSI is a momentum indicator employed to identify overbought or oversold conditions in the market. By measuring the strength of an asset's price action through the comparison of average gains and losses over a specific period, RSI provides insights into potential trend exhaustion or initiation.
How do these indicators contribute to identifying price patterns?
Price action indicators contribute to the identification of price patterns by offering visual cues and quantitative measures that highlight potential entry or exit points for trades. Moving averages, for instance, provide a smoothed representation of price trends, aiding in recognizing patterns such as upward or downward trends.
MACD, with its dual moving average structure and histogram, not only identifies trends but also signals potential changes in momentum. Bollinger Bands, by assessing volatility, help traders identify patterns indicative of overbought or oversold conditions. RSI, through its measurement of price strength, aids in recognizing situations where a trend may be losing steam or gaining momentum.
Advanced price action trading techniques
Advanced price action trading techniques, specifically Fibonacci retracement and Elliott Wave Theory, offer traders valuable insights for achieving a more profound understanding of market price action.
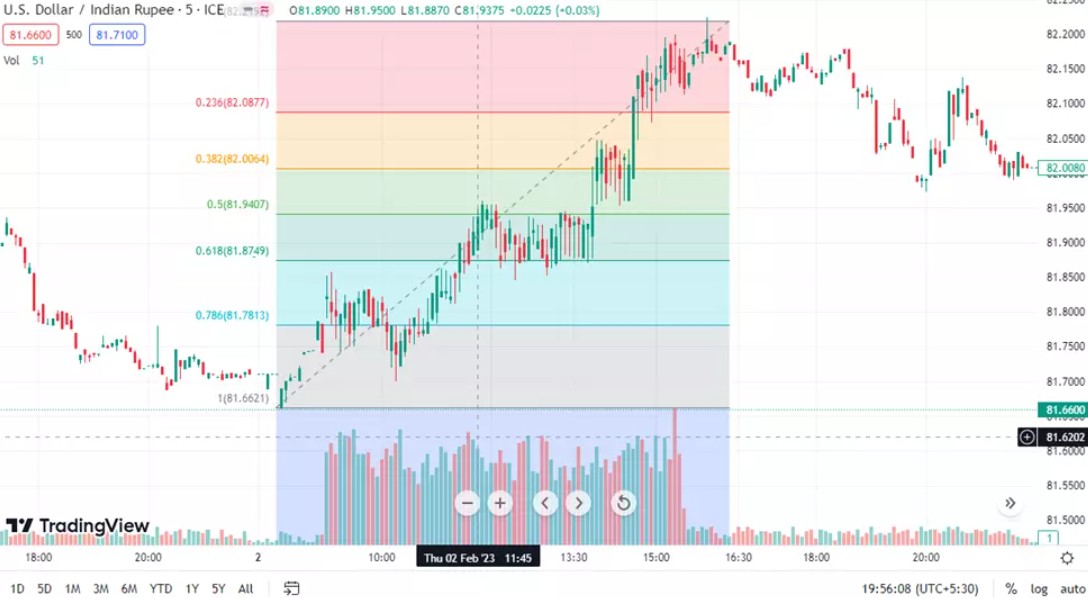
Fibonacci retracement
Fibonacci retracement is a sophisticated tool in technical analysis that utilizes horizontal lines to pinpoint areas of support or resistance at key Fibonacci levels. The core concept is rooted in the belief that markets tend to retrace a predictable portion of a move before resuming their original direction.
Elliott Wave Theory
Elliott Wave Theory is another advanced tool in technical analysis that relies on wave patterns to discern market trends and reversals. According to this theory, markets move in a series of five waves in the direction of the trend, followed by three corrective waves.
Traders leveraging Elliott Wave Theory can identify potential trend reversals and make informed decisions based on the observed wave patterns. This technique adds a layer of sophistication to price action analysis, allowing traders to align their strategies with the broader market trends.

Combining techniques for deeper insight
Integration
These advanced techniques, when used in conjunction with other technical analysis tools and strategies, empower traders to confirm price patterns and make well-informed decisions. The synergy of Fibonacci retracement and Elliott Wave Theory with existing analytical approaches enhances a trader's ability to navigate the complexities of market price action.
Strategic decision-making
The identification of key support and resistance levels through Fibonacci retracement, coupled with the trend insights from Elliott Wave Theory, provides traders with a comprehensive understanding of market dynamics. This, in turn, aids in strategic decision-making, helping traders to position themselves effectively in the market.
Confirmation of price patterns
The advanced nature of these techniques adds a layer of confirmation to price patterns, reducing the likelihood of false signals. Traders gain confidence in their analyses, making it more likely that their actions align with actual market conditions.
Recognizing false signals and market anomalies
Recognizing false signals and market anomalies is crucial for successful binary trading. These strategies help traders filter unreliable price action moves and focus on accurate setups.
Use volume analysis to verify breakouts. Look at volume to confirm breakouts. If volume doesn’t rise with the breakout, it’s probably fake. Wait for strong volume to back the move before entering a trade.
Focus on candle patterns near key levels. False signals usually show up when prices test big support or resistance levels. Watch for candlestick patterns like pin bars or engulfing candles near these levels. If the price breaks but quickly reverses with these patterns, it’s likely a false breakout.
Analyze market conditions for anomalies. Check market conditions for unusual moves. Use tools like ATR to see if volatility supports your trade idea. False signals often happen in choppy markets where price action is less reliable.
Beware of news-driven spikes. News can cause sharp moves that may not last, creating false signals. Avoid trading immediately after big announcements unless the move matches the market’s ongoing trend.
Common mistakes in price action trading
Understanding price action trading is vital, but avoiding common mistakes can significantly impact profitability. Here are the top mistakes traders should avoid:
Overtrading. Traders often get excited by price action patterns and place too many trades without proper validation. It’s essential to confirm patterns using additional indicators or by considering the market context.
Ignoring market context. A candlestick pattern may indicate a reversal, but if it occurs during a period of low market volatility, the signal might fail. Always assess patterns in conjunction with market conditions like trading volume or news events.
Not using stop-loss orders. Many traders fail to define stop-loss levels, leading to unmanageable losses. Price action trading requires disciplined risk management.
Confirmation bias. Some traders interpret signals in a way that aligns with their expectations, ignoring contradictory evidence. Staying objective and adhering to a tested strategy is crucial.
Combining price action with indicators
While price action trading often focuses on patterns, integrating indicators can improve accuracy. Here are some popular combinations:
Price action + RSI (Relative Strength Index).
Use RSI to confirm overbought or oversold conditions in conjunction with reversal patterns like pin bars.Price action + Moving averages.
Combine moving averages to identify the overall trend and use price action patterns to determine precise entry and exit points.Price action + Bollinger bands.
Look for patterns like pin bars near the upper or lower Bollinger Bands, indicating potential reversals in high-volatility conditions.Volume indicators.
Use trading volume as a secondary confirmation for price action signals. For example, a breakout pattern accompanied by high volume is more reliable.
The role of market sentiment in price action trading
Understanding market sentiment can enhance the effectiveness of price action strategies:
Bullish sentiment. Look for patterns like ascending triangles or bullish engulfing during positive market conditions.
Bearish sentiment. Patterns such as descending triangles or bearish engulfing are more reliable during negative sentiment.
Neutral sentiment. During consolidation, inside bars and breakout patterns become critical.
Market sentiment can be gauged using tools like the Commitment of Traders (COT) report or sentiment indicators available on trading platforms.
| TU overall score | Min. trade size | Max. Payout (%) | Max. Payout (%) | Demo | Open an account | |
|---|---|---|---|---|---|---|
| 9.4 | 1 | 128 | 128 | Yes | Open an account Your capital is at risk. |
|
| 9.1 | 1 | 92 | 92 | Yes | Open an account Your capital is at risk.
|
|
| 8.7 | 1 | 95 | 95 | Yes | Open an account Your capital is at risk. |
|
| 7.16 | 0.01 | 95 | 95 | Yes | Open an account Your capital is at risk. |
|
| 6.83 | 0.01 | 95 | 95 | Yes | Open an account Your capital is at risk. |
Master wick rejections and multi-timeframe tactics for binary trading success

Price action trading is more than spotting patterns — it’s about timing your trades with the right setup. A great trick is watching for "wick rejections" at big price levels. When you see a candlestick with a long wick hitting support or resistance, don’t jump in too soon. Let the next candle confirm by closing past the wick’s midpoint. This simple step helps you avoid traps like fake breakouts or quick reversals.
Another smart tactic is using multi-timeframe analysis to improve your accuracy. Spot the overall trend on a 4-hour chart, but zoom into the 15-minute chart for entry signals like inside bars or break-and-retest setups. Also, watch price gaps from the last trading day — they often act as strong support or resistance levels. Combining long-term trends, short-term signals, and price gaps turns price action trading into a calculated strategy, not guesswork.
Conclusion
By avoiding common mistakes, combining price action with technical indicators, and incorporating advanced strategies like Fibonacci retracement and Elliott Wave Theory, traders can improve their success rate. Additionally, real-life examples and understanding market sentiment provide deeper insights into binary options trading. Mastering these aspects requires discipline, practice, and continuous learning.
FAQs
How do you trade options with price action?
Trading options with price action involves analyzing recent and historical price movements to make informed decisions. Utilize price action indicators, identify patterns, and consider trend directions to enter or exit trades.
What is the best way to trade binary options?
The best way to trade binary options is by combining a sound strategy with effective risk management. Understand market trends, use technical analysis tools, and implement risk mitigation techniques to enhance the probability of successful trades.
What is the 5-minute binary strategy?
The 5-minute binary strategy involves making short-term trades based on price movements within a 5-minute time frame. Traders often use quick analysis, such as candlestick patterns and indicators, to capitalize on short-term market fluctuations.
How do you predict binary options trading?
Predicting binary options trading involves a comprehensive approach. Use technical analysis, fundamental analysis, and market indicators. Combine these with a thorough understanding of the chosen asset, market trends, and economic factors to make more informed predictions.
Related Articles
Team that worked on the article
Oleg Tkachenko is an economic analyst and risk manager having more than 14 years of experience in working with systemically important banks, investment companies, and analytical platforms. He has been a Traders Union analyst since 2018. His primary specialties are analysis and prediction of price tendencies in the Forex, stock, commodity, and cryptocurrency markets, as well as the development of trading strategies and individual risk management systems. He also analyzes nonstandard investing markets and studies trading psychology.
Also, Oleg became a member of the National Union of Journalists of Ukraine (membership card No. 4575, international certificate UKR4494).
Chinmay Soni is a financial analyst with more than 5 years of experience in working with stocks, Forex, derivatives, and other assets. As a founder of a boutique research firm and an active researcher, he covers various industries and fields, providing insights backed by statistical data. He is also an educator in the field of finance and technology.
As an author for Traders Union, he contributes his deep analytical insights on various topics, taking into account various aspects.
Mirjan Hipolito is a journalist and news editor at Traders Union. She is an expert crypto writer with five years of experience in the financial markets. Her specialties are daily market news, price predictions, and Initial Coin Offerings (ICO).
Index in trading is the measure of the performance of a group of stocks, which can include the assets and securities in it.
Bollinger Bands (BBands) are a technical analysis tool that consists of three lines: a middle moving average and two outer bands that are typically set at a standard deviation away from the moving average. These bands help traders visualize potential price volatility and identify overbought or oversold conditions in the market.
Overtrading is a phenomenon where a trader executes too many transactions in the market, surpassing their strategy and trading more frequently than planned. It's a common mistake that can lead to financial losses.
Day trading involves buying and selling financial assets within the same trading day, with the goal of profiting from short-term price fluctuations, and positions are typically not held overnight.
Uptrend is a market condition in which prices are generally rising. Uptrends can be identified by using moving averages, trendlines, and support and resistance levels.


-
 Afghanistan
-
 Albania
-
 Algeria
-
 Argentina
-
 Armenia
-
 Australia
-
 Austria
-
 Azerbaijan
-
 Bahamas
-
 Bahrain
-
 Bangladesh
-
 Belgium
-
 Botswana
-
 Brazil
-
 Brunei
-
 Bulgaria
-
 Burma
Burma
-
 Cambodia
-
 Cameroon
-
 Canada
-
 Chile
Chile
-
 China
China
-
 Colombia
-
 Costa Rica
-
 Cote d'Ivoire
-
 Croatia
-
 Cyprus
-
 Czech Republic
-
 Denmark
-
 Dominican Republic
-
 Ecuador
-
 Egypt
Egypt
-
 Estonia
-
 Eswatini
-
 Ethiopia
-
 Finland
-
 France
-
 Georgia
-
 Germany
-
 Ghana
Ghana
-
 Greece
-
 Haiti
Haiti
-
 Hong Kong
-
 Hungary
-
 India
India
-
 Indonesia
-
 Iran, Islamic republic
-
 Iraq
Iraq
-
 Ireland
-
 Israel
-
 Italy
Italy
-
 Jamaica
-
 Japan
Japan
-
 Jordan
-
 Kazakhstan
-
 Kenya
Kenya
-
 Korea
Korea
-
 Kuwait
-
 Kyrgyzstan
-
 Laos
Laos
-
 Latvia
-
 Lebanon
-
 Libyan Arab Jamahiriya
-
 Lithuania
-
 Luxembourg
-
 Macedonia
-
 Madagascar
-
 Malaysia
-
 Malta
Malta
-
 Mauritius
-
 Mexico
-
 Moldova
-
 Mongolia
-
 Montenegro
-
 Morocco
-
 Mozambique
-
 Namibia
-
 Nepal
Nepal
-
 Netherlands
-
 Nigeria
-
 Norway
-
 Oman
Oman
-
 Pakistan
-
 Palestine
-
 Papua New Guinea
-
 Peru
Peru
-
 Philippines
-
 Poland
-
 Portugal
-
 Puerto Rico
-
 Qatar
Qatar
-
 Romania
-
 Rwanda
-
 Saudi Arabia
-
 Serbia
-
 Singapore
-
 Slovakia
-
 Slovenia
-
 Somalia
-
 South Africa
-
Spain
-
 Sri Lanka
-
 Sweden
-
 Switzerland
-
 Syrian Arab Republic
-
 Taiwan
-
 Tajikistan
-
 Tanzania, United Republic Of
-
 Thailand
-
 Trinidad and Tobago
-
 Tunisia
-
 Turkey
-
 UAE
UAE
-
 Uganda
-
 Ukraine
-
 United Kingdom
-
 United States
-
 Uzbekistan
-
 Venezuela
-
 Vietnam
-
 Yemen
Yemen
-
 Zambia
-
 Zimbabwe
- Forex
- Crypto
- Price action candlesticks and patterns
- What is a price action strategy?
- How do price action indicators identify patterns?
- Price action techniques
- False signals and market anomalies
- Common mistakes in trading
- Combining price action with indicators
- Market sentiment in price action
- Expert opinion
- Conclusion
- FAQs
