Master the Momentum Indicator: Boost Your Trading Strategy with Precision


Editorial Note: While we adhere to strict Editorial Integrity, this post may contain references to products from our partners. Here's an explanation for How We Make Money. None of the data and information on this webpage constitutes investment advice according to our Disclaimer.
Momentum indicators help traders gauge the strength and speed behind price movements, making it easier to confirm trends and avoid weak setups. Tools like RSI, MACD, and Stochastic Oscillator highlight overbought or oversold zones and identify when momentum supports or contradicts price action — helping traders enter and exit with greater confidence.
Momentum indicators are not just there to back up trend signals. They show how strong the move really is and help you spot shifts before price does. When price is pushing but momentum is fading, that is a warning sign many people miss. These tools are not built to tell you when to jump in. They are built to tell you if the move has real strength or if it is starting to fade. In this article, we will take a detailed look into the top momentum indicators and teach you how to use them correctly.
Introduction to momentum indicators
Momentum indicators are tools that help traders measure the strength or speed of a price movement. Instead of focusing on the direction of the trend alone, momentum indicators give insight into how strong that move is — and whether it’s likely to continue or fade.
What they do
Track how fast price is moving in one direction.
Help identify potential reversals or trend continuation.
Alert traders when an asset is overbought or oversold.
These indicators are also used to spot early signs of exhaustion, making them helpful for both trend-followers and counter-trend traders. They are especially useful when price appears to be stalling, offering a way to confirm or question the move.
Why they matter
Useful for timing entries and exits.
Help avoid trades when a trend is losing energy.
Can highlight hidden strength or weakness that isn’t obvious in price alone.
Some of the most popular momentum indicators include RSI, MACD, Stochastic Oscillator, and Rate of Change — all widely used across markets and timeframes.
Origin and development of momentum indicators
Momentum indicators were developed out of the need to measure price behavior more deeply than just direction. Traders wanted tools that could show how strong a trend was and whether the move had enough energy to continue.
Early development
Originally derived from physics, where momentum refers to mass in motion.
Adapted to finance as a way to measure how quickly price changes over time.
One of the earliest forms was the Rate of Change (ROC) — calculated by comparing current price to past price.
Rise in popularity
With the growth of technical analysis in the 1970s and 80s, momentum tools became more refined.
Indicators like Relative Strength Index (RSI) and Moving Average Convergence Divergence (MACD) gained wide adoption.
These tools gave traders a new way to measure trend quality and anticipate reversals.
Types of momentum indicators
Momentum indicators come in different forms, each with its own way of showing how strong or weak a move is. Some measure how far price has moved in a given time. Others show whether a move is losing energy or building up steam. Understanding the differences helps you pick the right tool for your style.
Relative strength index (RSI)
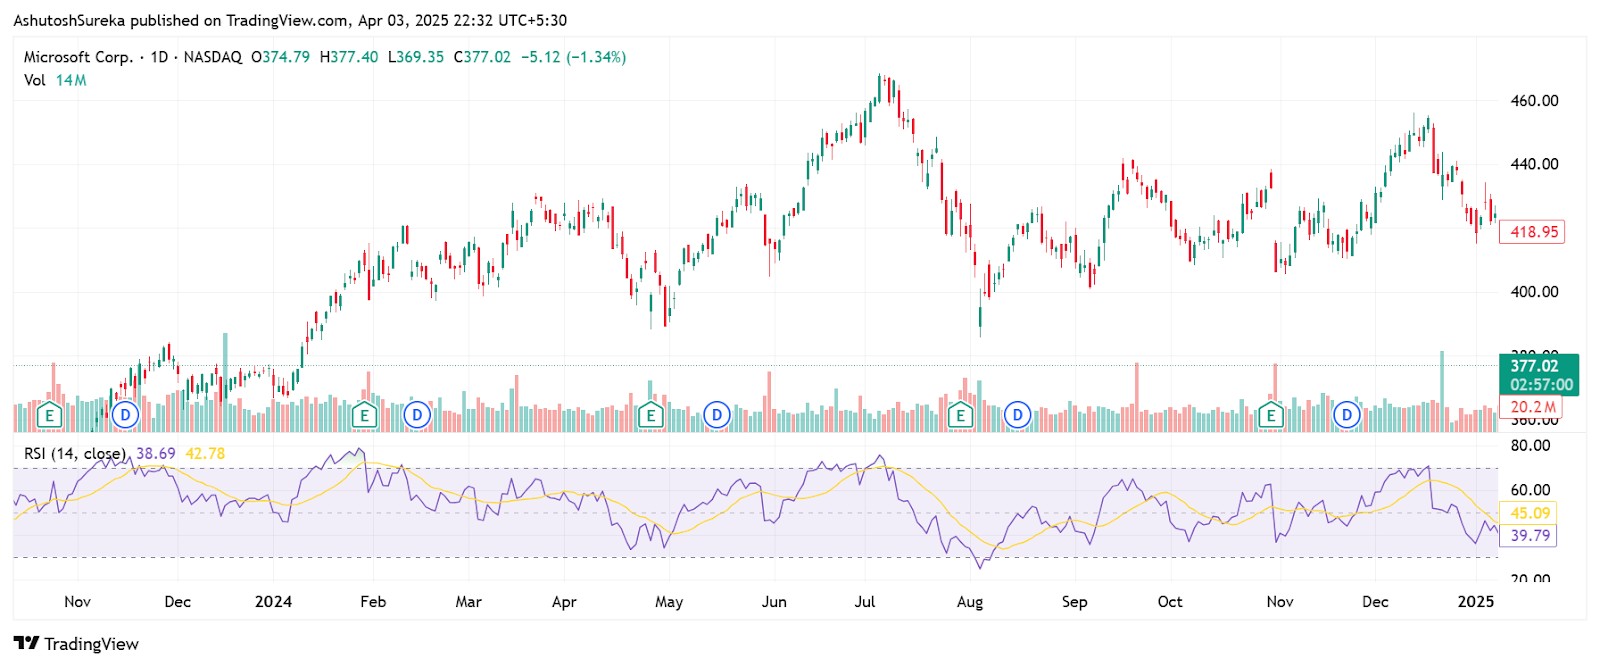
RSI is one of the most popular momentum indicators. It measures the speed and size of recent price changes to show whether an asset is overbought or oversold.
What it shows
RSI values range between 0 and 100.
A reading above 70 usually means overbought.
A reading below 30 suggests oversold.
It is also known for spotting divergences between price and momentum.
Why traders use it
Helps time entries and exits based on extreme conditions.
Useful for spotting potential reversals.
Can work on its own or alongside trend indicators.
Moving average convergence divergence (MACD)
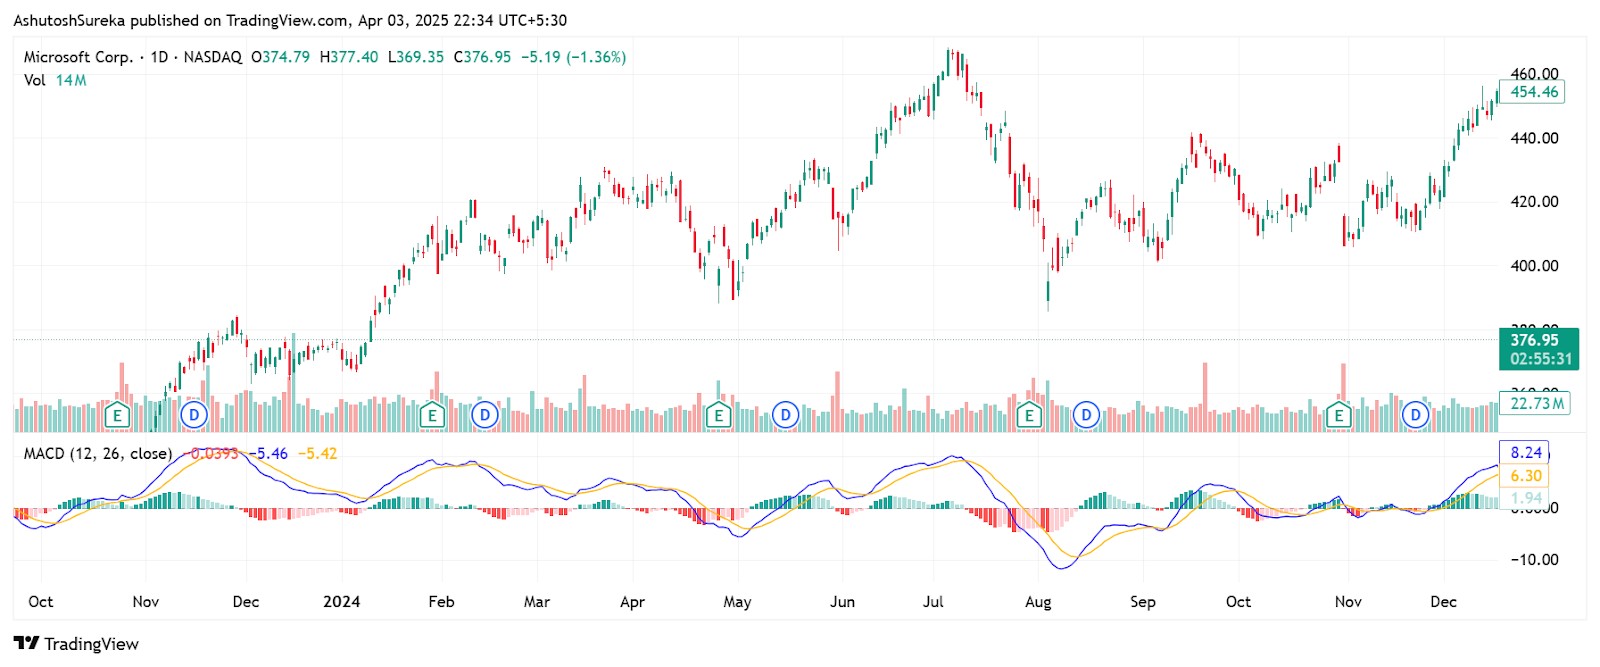
MACD is a two-part momentum and trend indicator that tracks the relationship between two moving averages and the strength of their separation.
What it shows
Uses a fast and a slow EMA to calculate momentum.
Plots a MACD line, signal line, and a histogram.
When the MACD line crosses above the signal line, it’s often seen as bullish.
When it crosses below, it can signal bearish momentum.
Why traders use it
Offers visual signals that are easy to read.
Helps confirm direction and strength of a trend.
The histogram gives early clues about changes in momentum.
Stochastic oscillator
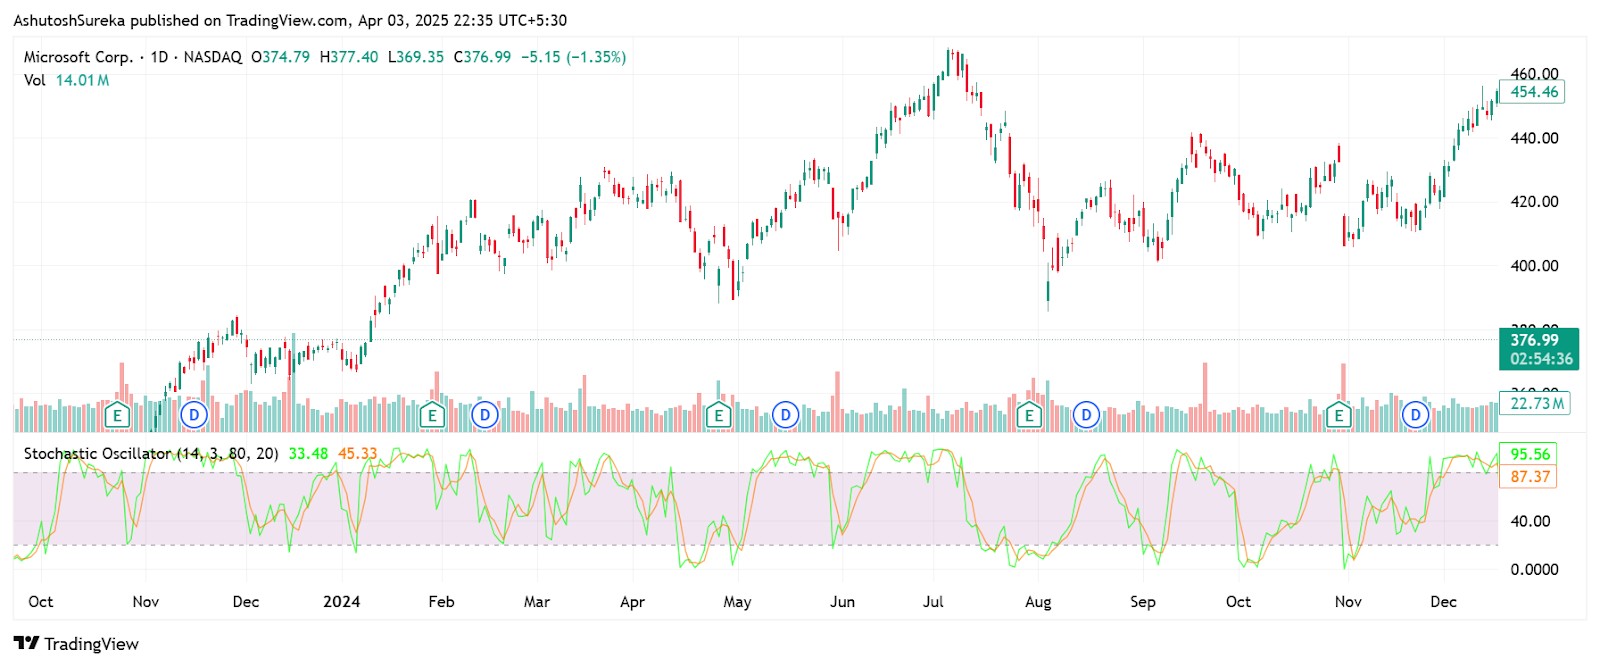
The stochastic oscillator compares the current closing price to the range of prices over a set period of time. It’s designed to show how strong the current move is within that range.
What it shows
Values range between 0 and 100.
Readings above 80 often suggest overbought.
Readings below 20 often suggest oversold.
It includes two lines — %K and %D — that can cross to give trading signals.
Why traders use it
Good for spotting reversals in range-bound markets.
Offers clear overbought and oversold zones.
Signals tend to come earlier than with RSI.
Understanding the momentum indicator formula
The momentum indicator is one of the simplest tools to calculate and use. It shows how quickly price is moving by comparing the current price to the price from a few periods ago. The formula gives you a raw number that rises or falls depending on whether the trend is gaining or losing strength.
The formula
Momentum = Current Closing Price − Closing Price n periods ago
Where:
Current Closing Price is the most recent candle’s closing value;
n periods ago is the number of candles you want to look back (commonly 10 or 14).
Example calculation
Let’s say the current closing price is 120 and the price 10 periods ago was 112.
Momentum = 120 − 112 = 8
A value of 8 means the price has moved 8 units upward over the last 10 candles. If the result were negative, it would show downward momentum.
What the values mean
A positive result means upward momentum.
A negative result signals downward pressure.
The larger the value (positive or negative), the stronger the momentum.
How traders use the result
Helps confirm if a breakout has real energy.
Used to compare price speed across different assets or timeframes.
Often paired with a moving average of the momentum line to spot shifts or crossovers.
How to set up momentum indicators
Momentum indicators are easy to add to any chart and take just a few tweaks to adjust. Once they’re set up, they can give real-time feedback on how strong a price move is — helping you confirm entries, spot fading momentum, or catch reversals early.
Access the indicator
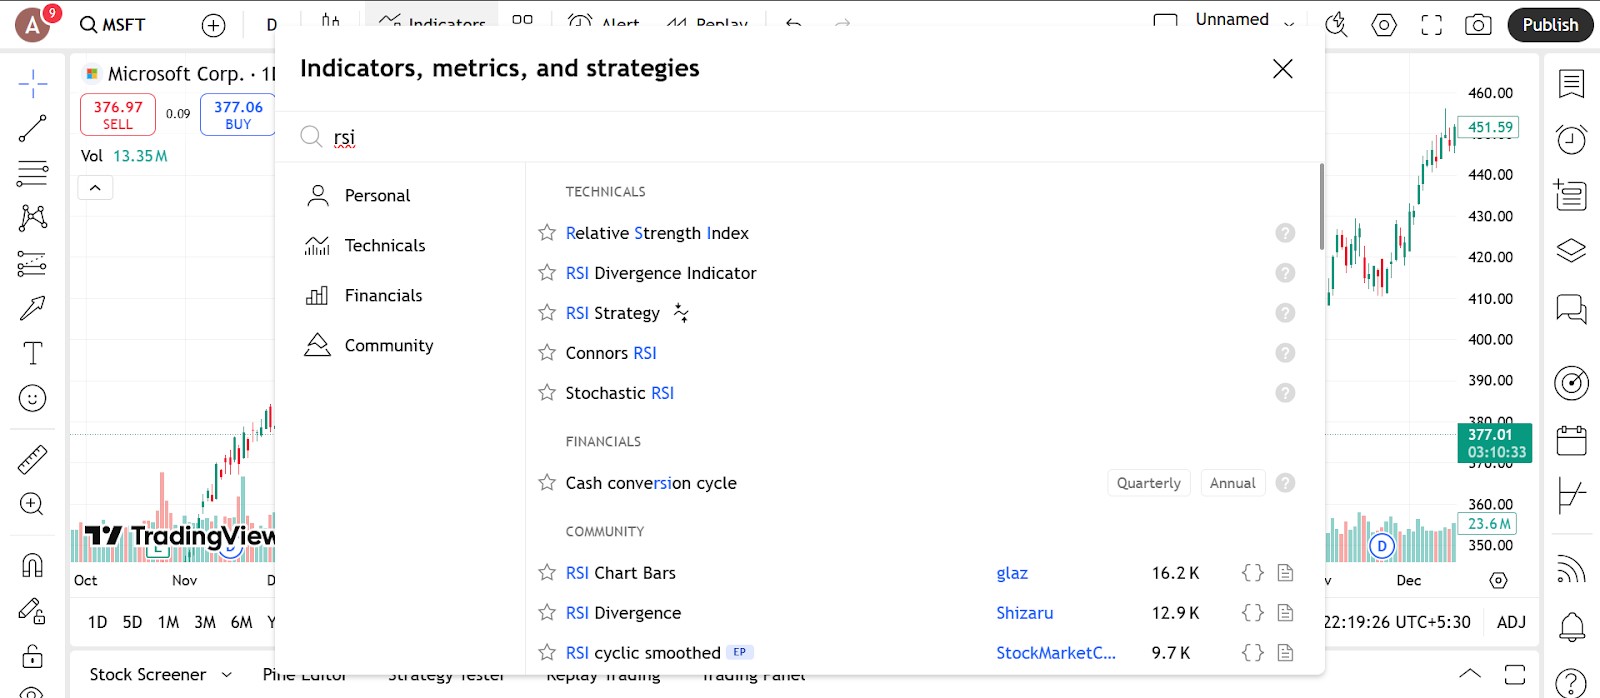
Adding a momentum indicator to your chart is a simple process on most platforms.
Where to find it
Open the indicators menu in your charting platform.
Search for the specific indicator by name — for example, RSI, MACD, Stochastic, ADX, or simply Momentum.
Click to apply — the indicator will appear in a separate pane below the main chart.
Compatible platforms
TradingView, MetaTrader, ThinkorSwim, NinjaTrader, and nearly all modern platforms support these indicators by default.
No extra plugins or downloads are usually needed.
Tips before starting
Add only one or two at first so your screen doesn’t get cluttered.
Choose indicators that match your trading style — trend-following or reversal setups.
Configure the parameters
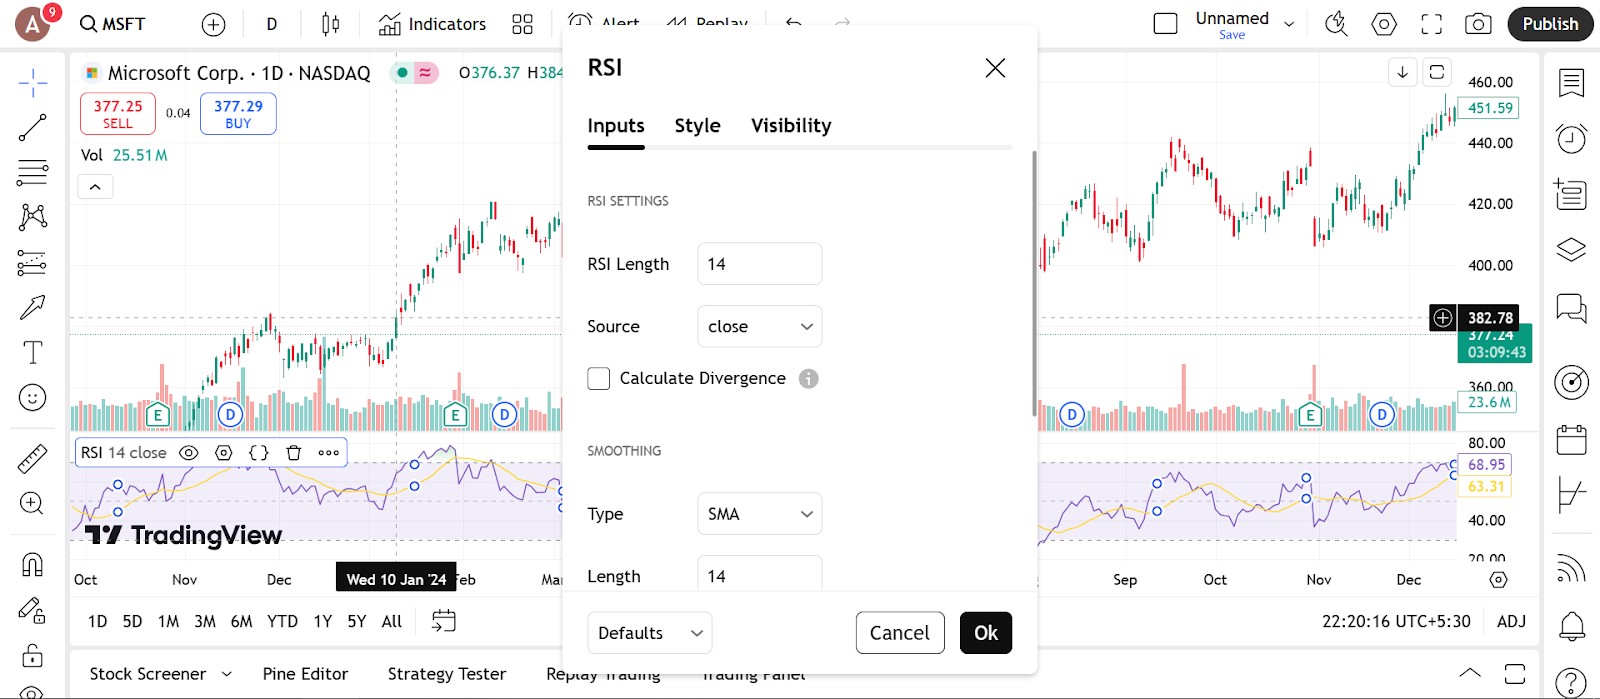
Each momentum indicator has its own set of inputs, but most follow a similar pattern — you choose the period length and adjust visual settings for clarity.
RSI settings
Default period is 14.
Shorter settings (like 7 or 10) make RSI more sensitive.
Longer settings (like 21) smooth out the line for more stable signals.
Customize overbought and oversold levels (default is 70 and 30).
MACD settings
Standard setup is 12, 26, 9 (fast EMA, slow EMA, and signal line).
Shorter periods increase sensitivity.
You can change the colors of the MACD line, signal line, and histogram for better visibility.
Stochastic settings
Typical input is 14, 3, 3.
Lower the period for quicker signals (e.g. 9, 3, 3).
Customize overbought and oversold thresholds (default is 80 and 20).
Trading strategies using momentum indicators
Each momentum indicator has its own style, and here’s how traders commonly use them.
RSI reversal strategy
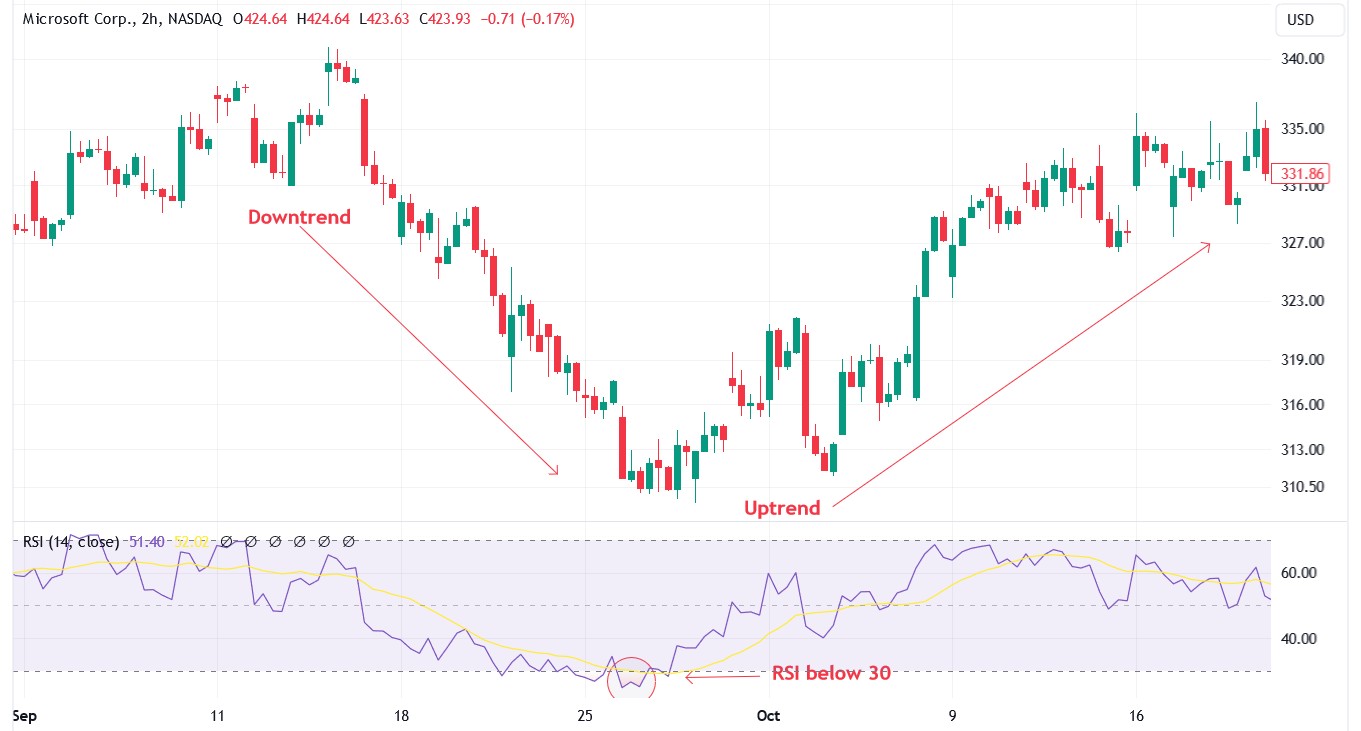
The Relative Strength Index (RSI) is great for spotting when a move might be overdone and due for a pullback or reversal.
How to use it
Wait for RSI to go above 70 (overbought) or below 30 (oversold).
Look for price to start slowing down or reversing direction.
Enter a trade in the opposite direction once price confirms the shift.
Use RSI divergence — when price makes a higher high but RSI makes a lower high — as extra confirmation.
Example setup
On a stock chart, RSI hits 75 but price starts forming a lower high.
Enter a short position when the candle confirms weakness.
Place a stop above the recent high and target a move back to the average.
MACD trend-following strategy
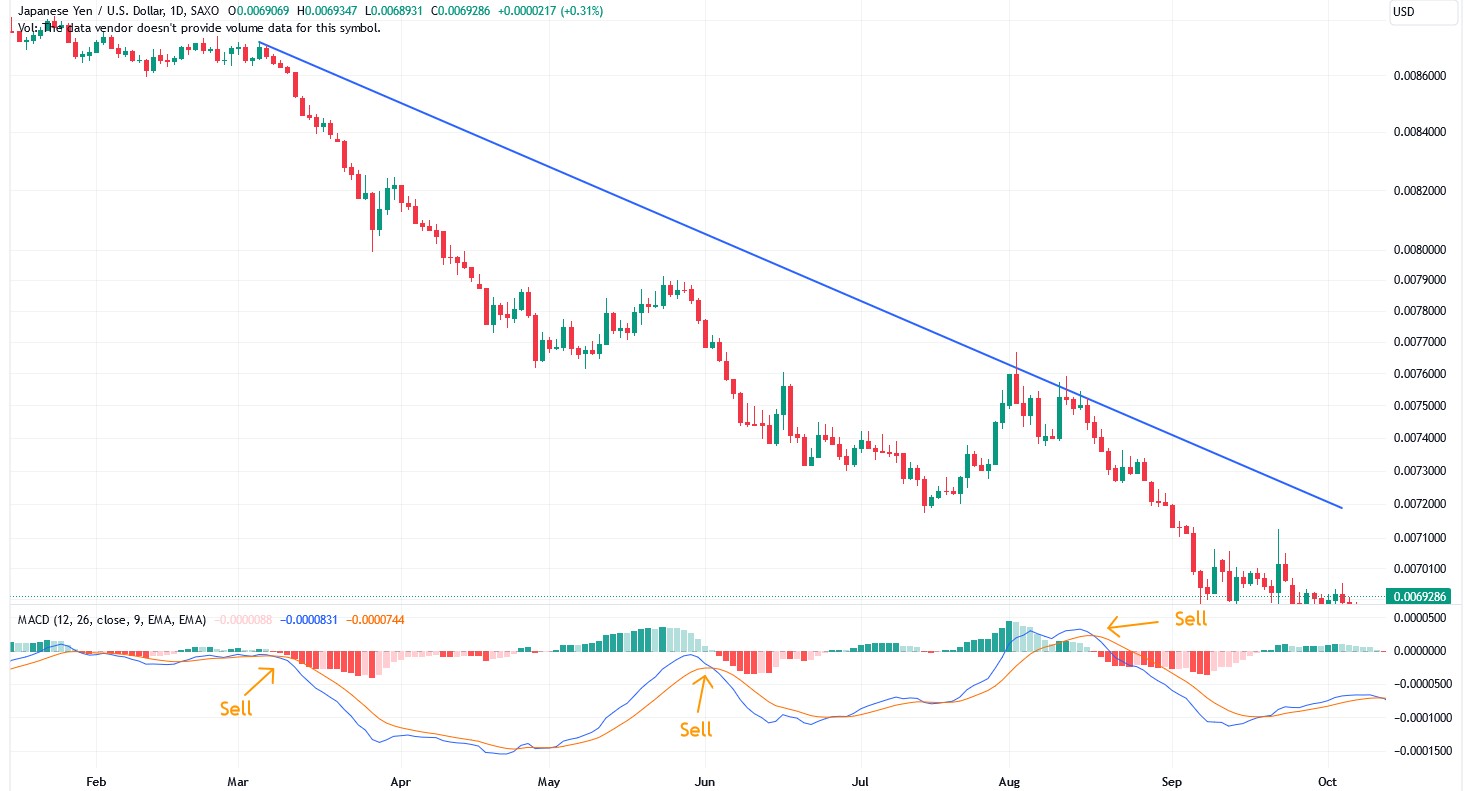
The MACD helps traders ride trends by showing changes in momentum and direction through moving average crossovers.
How to use it
Wait for the MACD line to cross above the signal line for a buy signal.
A cross below the signal line signals a potential sell.
The histogram can also act as an early warning sign — when it shifts from positive to negative, it hints at a loss in momentum.
Example setup
Use a 12, 26, 9 MACD on a 4-hour chart.
When the MACD line crosses above the signal and the histogram grows, enter a long trade.
Exit when the histogram starts shrinking or a bearish cross appears.
Stochastic oscillator range reversal strategy
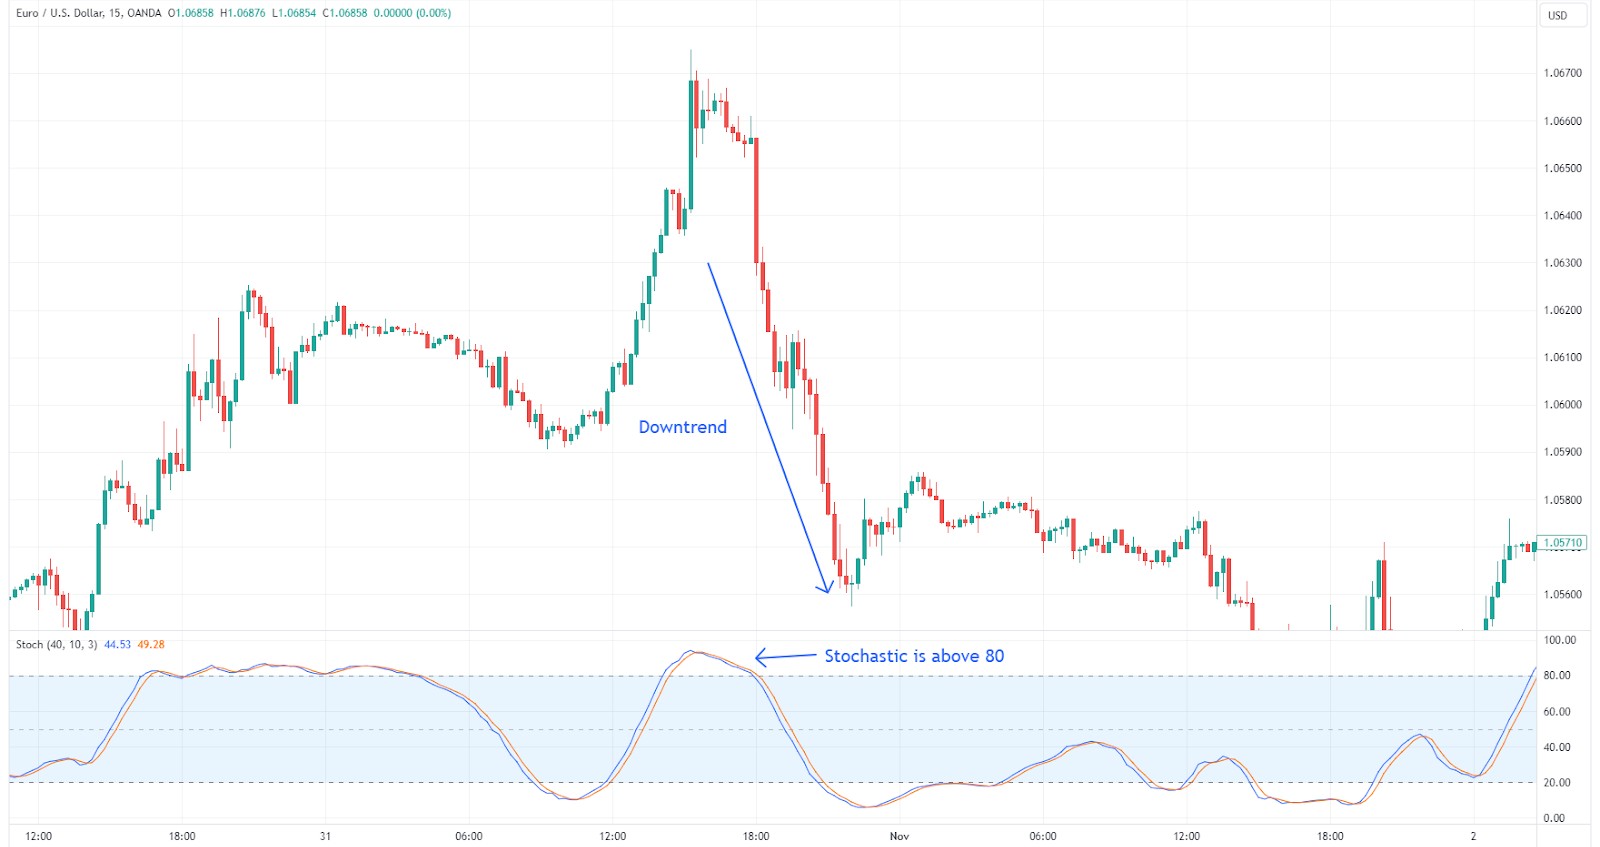
The Stochastic Oscillator works best when price is moving within a sideways range. It signals possible tops and bottoms based on price closing strength within a recent range.
How to use it
Buy when the %K line crosses above the %D line in the oversold zone (below 20).
Sell when the %K crosses below the %D in the overbought zone (above 80).
Works well in flat or slow markets, not trending ones.
Example setup
In a consolidating market, stochastic shows a bullish cross at 15.
Enter long and target the top of the range.
Exit when the oscillator crosses back down near the overbought area.
If your trading strategy requires the use of many technical indicators, using a broker that supports TradingView, MT5, or cTrader can make your life easier. These tools provide access to a wide range of technical tools, covering almost all the strategies you can think of. In the table below, we have presented the top brokers with access to the abovementioned platforms. You can compare them and choose the best one for yourself:
| Currency pairs | Crypto | Stocks | Min. deposit, $ | Max. leverage | TradingView | MT5 | cTrader | Regulation | TU overall score | Open an account | |
|---|---|---|---|---|---|---|---|---|---|---|---|
| 60 | Yes | Yes | 100 | 1:300 | Yes | No | No | FCA, CySEC, MAS, ASIC, FMA, FSA (Seychelles) | 6.83 | Open an account Your capital is at risk. |
|
| 90 | Yes | Yes | No | 1:500 | Yes | Yes | Yes | ASIC, FCA, DFSA, BaFin, CMA, SCB, CySec | 7.17 | Open an account Your capital is at risk.
|
|
| 68 | Yes | Yes | No | 1:200 | Yes | Yes | No | FSC (BVI), ASIC, IIROC, FCA, CFTC, NFA | 6.8 | Open an account Your capital is at risk. |
|
| 80 | Yes | Yes | 100 | 1:50 | Yes | Yes | No | CIMA, FCA, FSA (Japan), NFA, IIROC, ASIC, CFTC | 6.95 | Study review | |
| 100 | Yes | Yes | No | 1:30 | Yes | No | No | SEC, FINRA, SIPC, FCA, NSE, BSE, SEBI, SEHK, HKFE, IIROC, ASIC, CFTC, NFA | 6.9 | Open an account Your capital is at risk. |
Why trust us
We at Traders Union have analyzed financial markets for over 14 years, evaluating brokers based on 250+ transparent criteria, including security, regulation, and trading conditions. Our expert team of over 50 professionals regularly updates a Watch List of 500+ brokers to provide users with data-driven insights. While our research is based on objective data, we encourage users to perform independent due diligence and consult official regulatory sources before making any financial decisions.
Learn more about our methodology and editorial policies.
Advantages of momentum indicators
Reveal the true strength behind price moves. Momentum indicators help you see whether a trend has real energy or is just drifting. They act like a pressure gauge, showing if there’s enough force behind the move to keep it going — or if things are starting to stall.
Keep you out of weak breakouts and late trades. Instead of chasing price after it's already moved, momentum tools like RSI or MACD help you judge whether there’s still juice left in the move or if it’s running on fumes.
Adapt well to both trends and sideways markets. In trending environments, tools like MACD and ADX confirm the move’s strength. In ranging markets, RSI and Stochastic help you catch early signs of reversal or exhaustion.
Blend easily into your existing strategy. Whether you’re using price action, moving averages, or volume analysis, momentum indicators give added confirmation without overcomplicating your chart.
Simple to read and quick to apply. Most momentum tools are visual and intuitive, making them perfect for spotting signals at a glance. They’re also beginner-friendly and already built into nearly every trading platform.
Limitations of momentum indicators
They can give false signals, especially in choppy or low-volume markets. Momentum indicators often misfire when price is stuck in a range. RSI or Stochastic can flash overbought or oversold too early, and MACD crossovers might happen without real follow-through. Without context, you risk jumping in too soon.
They lag — and that’s by design. Since most momentum tools are built on past price, they tend to confirm a move after it’s already underway. Fast reversals or sharp market turns can catch these indicators off guard, which makes them less reliable on their own.
They need confirmation from other tools or context. A momentum spike or an overbought reading isn’t a trade signal by itself. For more reliable setups, pair momentum with chart patterns, support/resistance, or trend lines to get a clearer read on what price is actually doing.
They require tuning to match your timeframe and style. What works on a 5-minute chart might fall apart on a daily chart. Every market and strategy reacts differently to indicator settings — so it takes testing and tweaking to find what truly fits.
Use momentum after clean breakouts, not in sideways markets

A common trap is trying to read momentum when the market is sideways. Momentum only matters when price is already moving clearly. If the chart is choppy and you see a spike in RSI or MACD, that is usually just noise.
First look for solid moves with room around the candles. Once price breaks out cleanly, then check the momentum. If it kicks in after the breakout, that is the kind of move that tends to hold. But if you use momentum tools in messy conditions, they will just send you in circles.
Here is something most traders do not pay attention to. Watch how fast momentum cools off after a strong move. Do not just watch for extreme readings. See how long it holds. If it fades fast after a breakout, the move was likely driven more by hype than follow-through. But if momentum stays strong even while price pulls back or consolidates, that usually means bigger players are stepping in quietly. Most people chase momentum spikes. You want to spot the slow burn that builds up behind real trends.
Conclusion
Momentum indicators are not designed to predict moves. They are there to show how strong a move really is once it starts. If you stop using them for early signals and start paying attention to what they are doing during real price shifts, you will be able to spot which moves have strength and which ones do not. When you let price speak first and use momentum to back it up, you will get in with more confidence and get out before the move runs out.
FAQs
Can momentum indicators be used for all types of financial instruments?
Yes, momentum indicators can be used across various financial instruments such as stocks, Forex, commodities, and cryptocurrencies. They help assess the strength and speed of price movements regardless of the asset type.
What is a momentum oscillator?
A momentum oscillator is a technical tool that measures the rate of price change over a specific period. It fluctuates within a range, helping traders identify overbought or oversold conditions and potential reversals.
Is momentum indicator and momentum oscillator the same?
They are closely related but not exactly the same. Momentum indicators include a broad category of tools, while momentum oscillators are a type of indicator that specifically moves within set bounds like RSI or Stochastic.
What is the difference between momentum trading and swing trading?
Momentum trading focuses on capturing quick price moves driven by strong trends or volume surges. Swing trading aims to profit from short- to medium-term price swings, often holding positions for several days or weeks.
Related Articles
Team that worked on the article
Mikhail Vnuchkov joined Traders Union as an author in 2020. He began his professional career as a journalist-observer at a small online financial publication, where he covered global economic events and discussed their impact on the segment of financial investment, including investor income. With five years of experience in finance, Mikhail joined Traders Union team, where he is in charge of forming the pool of latest news for traders, who trade stocks, cryptocurrencies, Forex instruments and fixed income.
Chinmay Soni is a financial analyst with more than 5 years of experience in working with stocks, Forex, derivatives, and other assets. As a founder of a boutique research firm and an active researcher, he covers various industries and fields, providing insights backed by statistical data. He is also an educator in the field of finance and technology.
As an author for Traders Union, he contributes his deep analytical insights on various topics, taking into account various aspects.
Mirjan Hipolito is a journalist and news editor at Traders Union. She is an expert crypto writer with five years of experience in the financial markets. Her specialties are daily market news, price predictions, and Initial Coin Offerings (ICO).
Cryptocurrency is a type of digital or virtual currency that relies on cryptography for security. Unlike traditional currencies issued by governments (fiat currencies), cryptocurrencies operate on decentralized networks, typically based on blockchain technology.
The Stochastic Oscillator is a technical indicator used in financial analysis to gauge the momentum of a security's price and identify overbought or oversold conditions by comparing the closing price to a specified price range over a defined period.
An investor is an individual, who invests money in an asset with the expectation that its value would appreciate in the future. The asset can be anything, including a bond, debenture, mutual fund, equity, gold, silver, exchange-traded funds (ETFs), and real-estate property.
Xetra is a German Stock Exchange trading system that the Frankfurt Stock Exchange operates. Deutsche Börse is the parent company of the Frankfurt Stock Exchange.
Algorithmic trading is an advanced method that relies on advanced coding and formulas based on a mathematical model. However, compared to traditional trading methods, the process differs by being automated.


-
 Afghanistan
-
 Albania
-
 Algeria
-
 Argentina
-
 Armenia
-
 Australia
-
 Austria
-
 Azerbaijan
-
 Bahamas
-
 Bahrain
-
 Bangladesh
-
 Belgium
-
 Botswana
-
 Brazil
-
 Brunei
-
 Bulgaria
-
 Burma
Burma
-
 Cambodia
-
 Cameroon
-
 Canada
-
 Chile
Chile
-
 China
China
-
 Colombia
-
 Costa Rica
-
 Cote d'Ivoire
-
 Croatia
-
 Cyprus
-
 Czech Republic
-
 Denmark
-
 Dominican Republic
-
 Ecuador
-
 Egypt
Egypt
-
 Estonia
-
 Eswatini
-
 Ethiopia
-
 Finland
-
 France
-
 Georgia
-
 Germany
-
 Ghana
Ghana
-
 Greece
-
 Haiti
Haiti
-
 Hong Kong
-
 Hungary
-
 India
India
-
 Indonesia
-
 Iran, Islamic republic
-
 Iraq
Iraq
-
 Ireland
-
 Israel
-
 Italy
Italy
-
 Jamaica
-
 Japan
Japan
-
 Jordan
-
 Kazakhstan
-
 Kenya
Kenya
-
 Korea
Korea
-
 Kuwait
-
 Kyrgyzstan
-
 Laos
Laos
-
 Latvia
-
 Lebanon
-
 Libyan Arab Jamahiriya
-
 Lithuania
-
 Luxembourg
-
 Macedonia
-
 Madagascar
-
 Malaysia
-
 Malta
Malta
-
 Mauritius
-
 Mexico
-
 Moldova
-
 Mongolia
-
 Montenegro
-
 Morocco
-
 Mozambique
-
 Namibia
-
 Nepal
Nepal
-
 Netherlands
-
 Nigeria
-
 Norway
-
 Oman
Oman
-
 Pakistan
-
 Palestine
-
 Papua New Guinea
-
 Peru
Peru
-
 Philippines
-
 Poland
-
 Portugal
-
 Puerto Rico
-
 Qatar
Qatar
-
 Romania
-
 Rwanda
-
 Saudi Arabia
-
 Serbia
-
 Singapore
-
 Slovakia
-
 Slovenia
-
 Somalia
-
 South Africa
-
 Spain
Spain
-
 Sri Lanka
-
 Sweden
-
 Switzerland
-
 Syrian Arab Republic
-
 Taiwan
-
 Tajikistan
-
 Tanzania, United Republic Of
-
 Thailand
-
 Trinidad and Tobago
-
 Tunisia
-
 Turkey
-
 UAE
UAE
-
 Uganda
-
 Ukraine
-
 United Kingdom
-
United States
-
 Uzbekistan
-
 Venezuela
-
 Vietnam
-
 Yemen
Yemen
-
 Zambia
-
 Zimbabwe
- Forex
- Crypto
- Introduction to momentum indicators
- Origin and development of momentum indicators
- Types of momentum indicators
- Momentum indicator formula
- How to set up momentum indicators
- Trading strategies using momentum indicators
- Advantages of momentum indicators
- Limitations of momentum indicators
- Expert opinion
- Conclusion
- FAQs
