Supply And Demand Zones: Key Strategies For Better Trades


Editorial Note: While we adhere to strict Editorial Integrity, this post may contain references to products from our partners. Here's an explanation for How We Make Money. None of the data and information on this webpage constitutes investment advice according to our Disclaimer.
Supply and demand zones are areas on a price chart where significant buying or selling activity has occurred, often leading to price reversals. To identify supply and demand zones in trading:
Step 1. Look for price reversals
Step 2. Focus on consolidation areas
Step 3. Check volume
Step 4. Draw Zones, not lines
Step 5. Validate with multiple timeframes
As a trader, understanding supply and demand zones can be a game-changer. These zones indicate areas on the price chart where buyers and sellers have shown significant interest, often leading to price reversals or continuations. Knowing how to identify and trade within these zones can help you make better trading decisions. In this guide, we’ll break down what supply and demand zones are, why they matter, and how you can apply this concept to improve your trading strategy.
Supply and demand zones - how to identify for trading properly
Supply and demand zones are areas on a price chart where significant buying or selling activity has occurred, often leading to price reversals. To identify these zones, look for areas where price has sharply moved up (demand) or down (supply) from a consolidated range, forming a base. Higher time frames like daily or weekly charts tend to show stronger, more reliable zones. Once identified, these zones can be used to plan entries, exits, and manage risk, as prices frequently react when revisiting these levels.
To identify supply and demand zones in trading:
Step 1. Look for price reversals. Identify areas on the chart where the price rapidly changes direction, indicating strong buying (demand) or selling (supply).
Step 2. Focus on consolidation areas. Prior to a significant price move, look for areas where the price consolidates sideways before breaking out or down.
Step 3. Check volume. Higher volume in these areas confirms stronger demand or supply.
Step 4. Draw zones, not lines. Mark zones as rectangles that encompass the price range where the reversals occurred, not just a single price level.
Step 5. Validate with multiple timeframes. Use higher and lower timeframes to confirm the strength and accuracy of the zones.
This helps traders pinpoint potential areas for entries and exits.
Key characteristics of supply and demand zones
Characteristics of supply and demand zones:
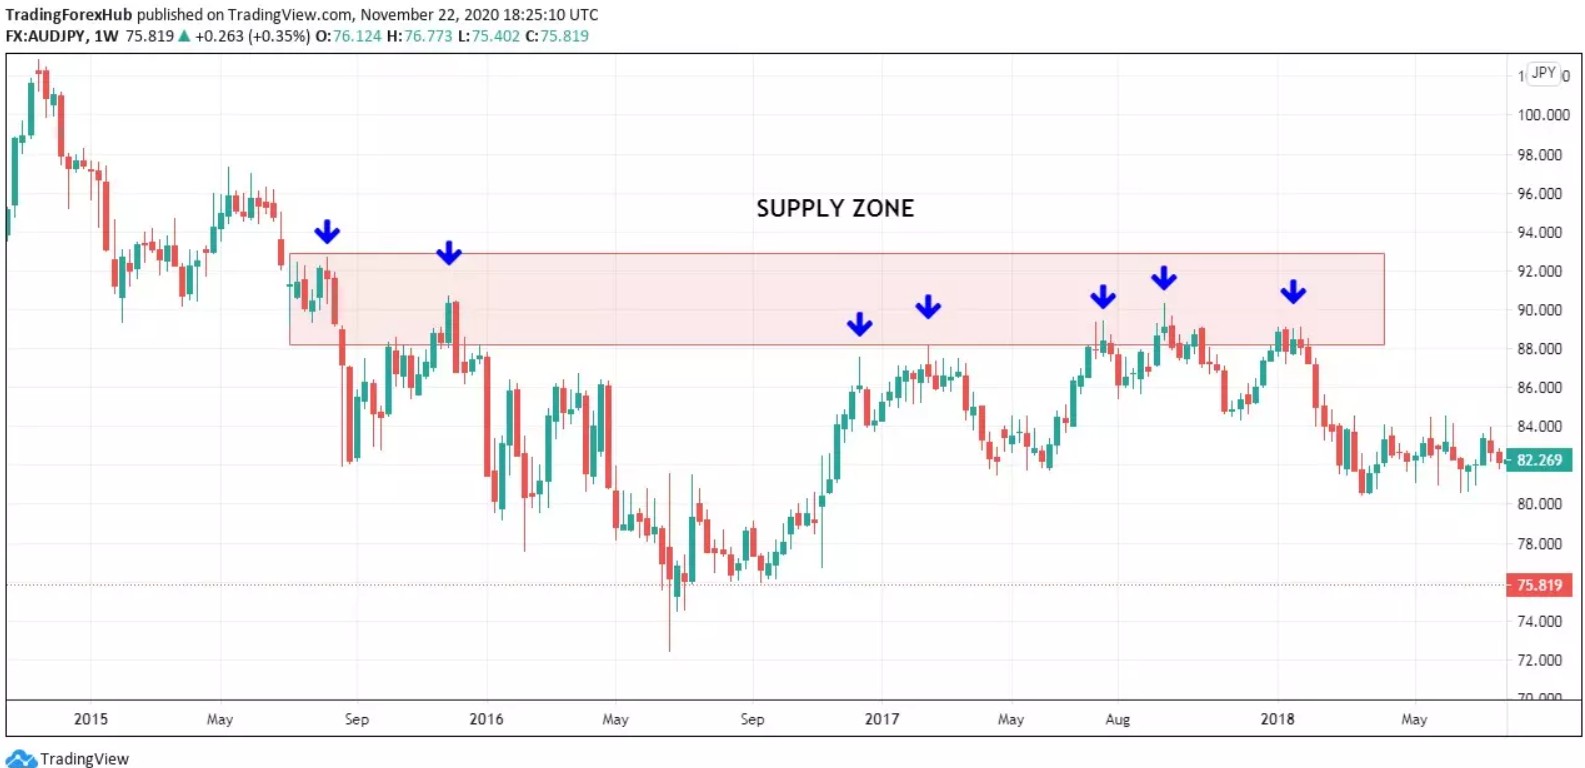
Supply zone (Resistance). This is an area where sellers have previously pushed the price down, often after a period of consolidation or strong upward movement.
When the price reaches a well-identified supply level, the pending sell orders are filled, often leading to a price decline. Refer to the chart below for a clearer understanding of how the supply zone operates.
Demand Zone (Support). This is an area where buyers have driven the price up, indicating strong interest in purchasing at this level. The chart below illustrates the concept of a demand zone more effectively.
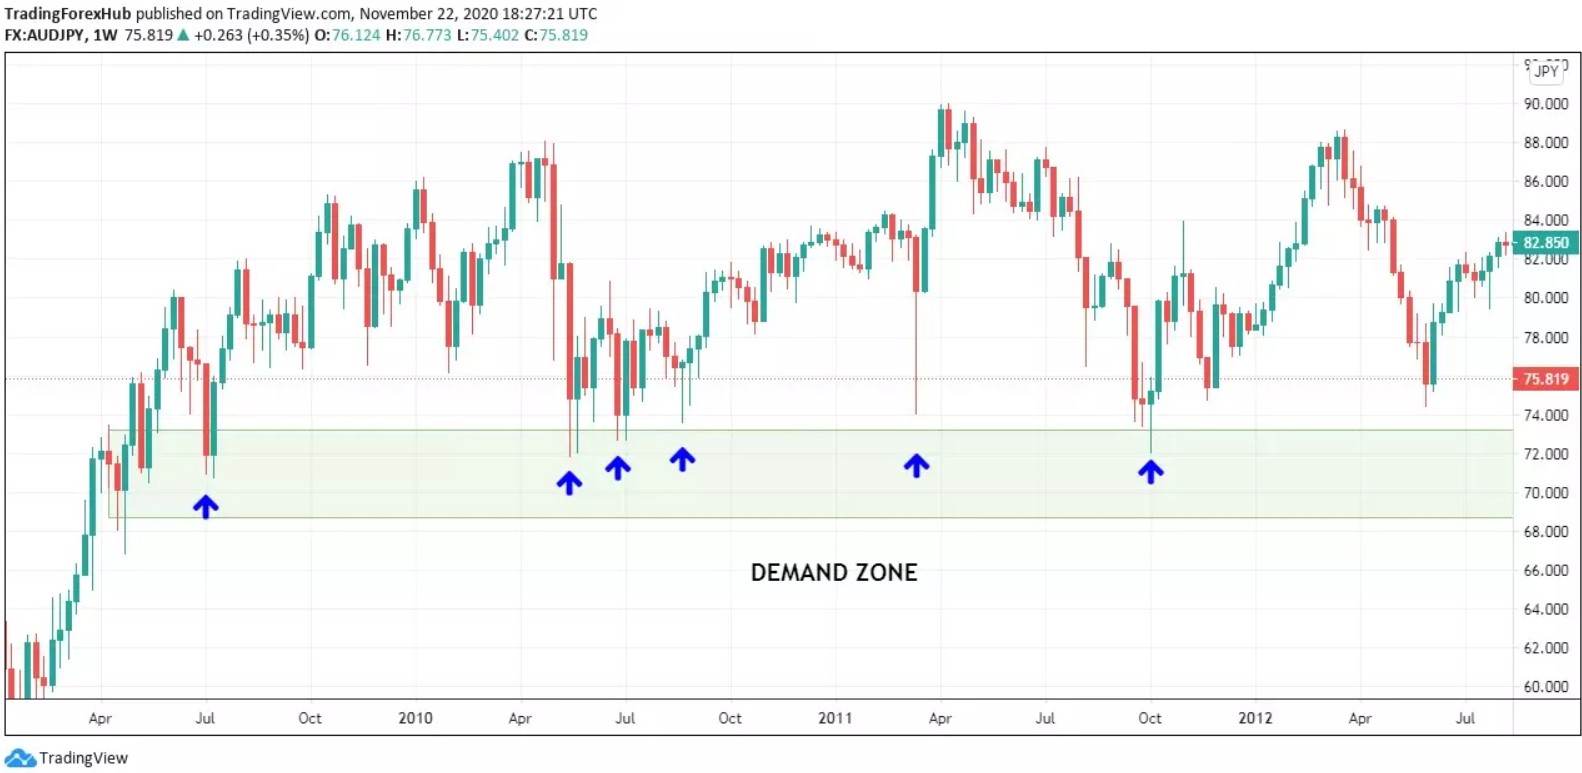
In this chart, you can see the price repeatedly reversing upward each time it dips into the shaded demand zone area.
Trading strategies for supply and demand zones
Just as with traditional price pattern analysis, supply and demand zones include both reversal and continuation patterns.
Reversal patterns
Reversal patterns signal a shift in the current price trend, either from an uptrend to a downtrend or vice versa. Here, we’ll look at two main reversal structures:
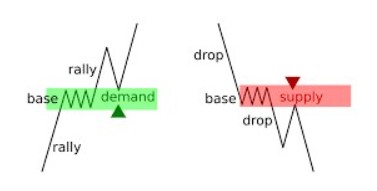
Drop-base-rally. In this structure, the price drops to a certain level, consolidates to form a base, and then rallies upward.
Rally-base-drop. Here, the price rises, establishes a base, and subsequently falls sharply.

In the chart below, you can spot the supply zone on the far left, followed by demand zones marked by these two structures. Notice how, in the supply zone, the price rallies, pauses at a base level, and then drops significantly, demonstrating a rally-base-drop pattern. The long candles moving downward emphasize the strong supply-demand imbalance at this level.

Conversely, in the demand zones, the price drops, forms a base, and then rallies, following the drop-base-rally structure.
Continuation patterns
Continuation patterns occur when the price trend proceeds in the same direction — either up or down — of the existing trend. These patterns tend to be weaker since the price often breaks through these levels. Two common continuation patterns include:
Drop-base-drop. In this structure, the price drops, consolidates briefly to create a base, and then continues to drop.
Rally-base-rally. In this case, the price rallies, pauses to form a base, and then resumes its upward movement.
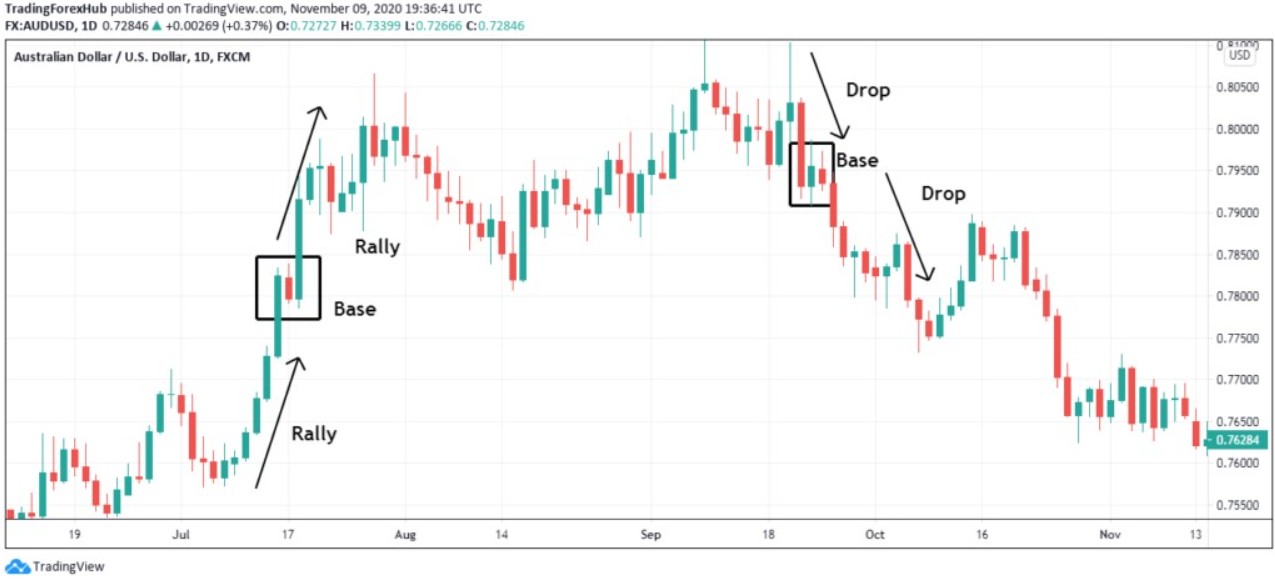
In the chart below, you’ll find a demand zone to the far left, while the supply zones are marked by subsequent structures. Observe that in the demand zone, the price rallies, pauses to form a base, and then continues upward, showcasing a rally-base-rally pattern, with long candles reflecting sustained upward movement.
Breakout strategy
To execute this strategy, start by finding key support and resistance levels where the price has made big moves in the past, either pausing or reversing direction. Before a breakout, the price usually moves sideways and gets stuck in a tighter range. Think of it like a spring getting loaded up, ready to pop. A breakout is when the price bursts through support or resistance, often with a surge in trading activity. Traders typically follow the breakout’s direction. If it breaks above resistance, it’s a cue to buy. If it breaks below support, that’s a heads-up to sell.
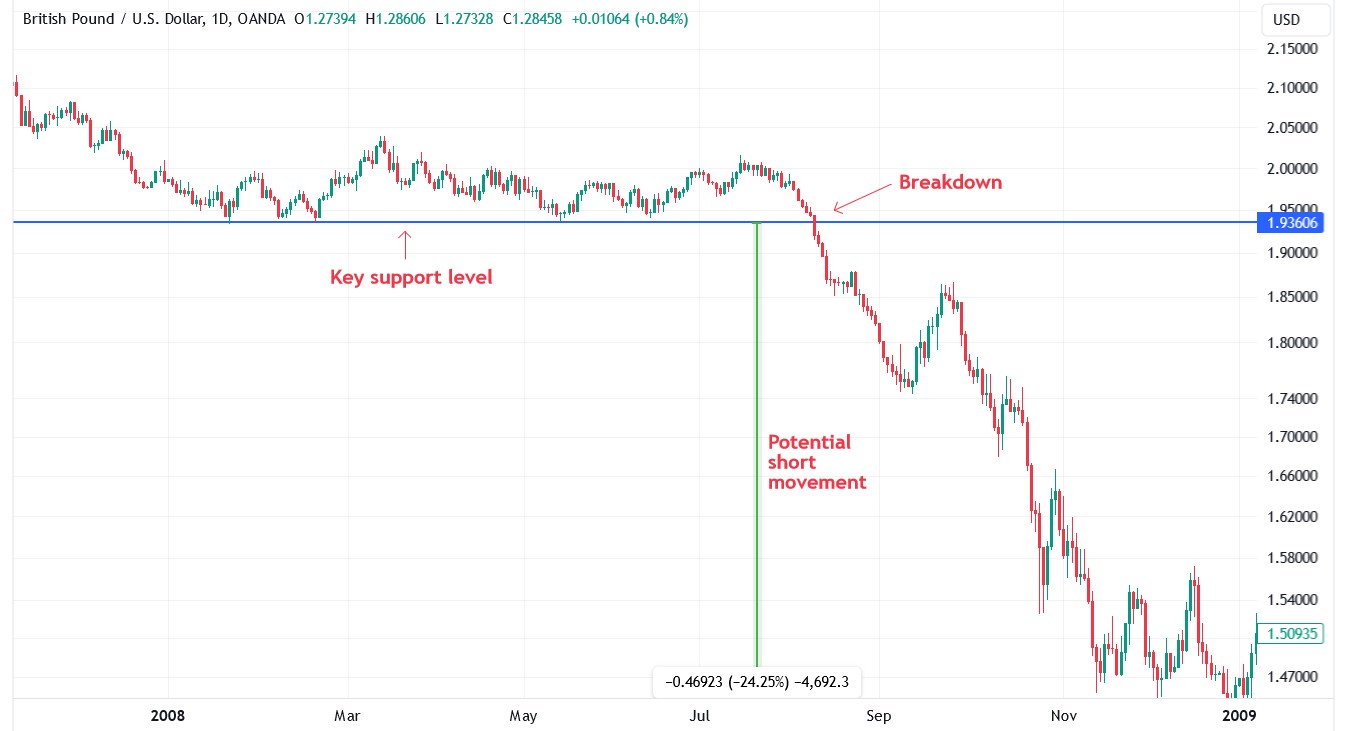
In this chart, you can see how the price held above a major support area for quite a while, with buyers stepping in each time to keep it from dropping. It’s almost like the market kept bouncing off the floor. But then, things took a turn when the price finally broke below that floor. Once it happened, the sellers took control, and the price fell hard and fast. The demand that had been keeping the market steady just wasn't there anymore, and the drop was pretty dramatic. Traders who were ready for this move could’ve jumped in and ridden the wave down, taking advantage of the strong downward momentum.
Range trading strategy
Range trading works best when the market isn’t moving in one clear direction and instead bounces between familiar high and low levels. In this strategy, traders watch for when the price gets close to the demand zone (where buying kicks in) or supply zone (where selling builds up). The goal is pretty straightforward: buy near the bottom of the range and sell near the top, taking advantage of these predictable price moves. But you have to be on your toes in case the price suddenly breaks out of this range, signaling that something big is happening.
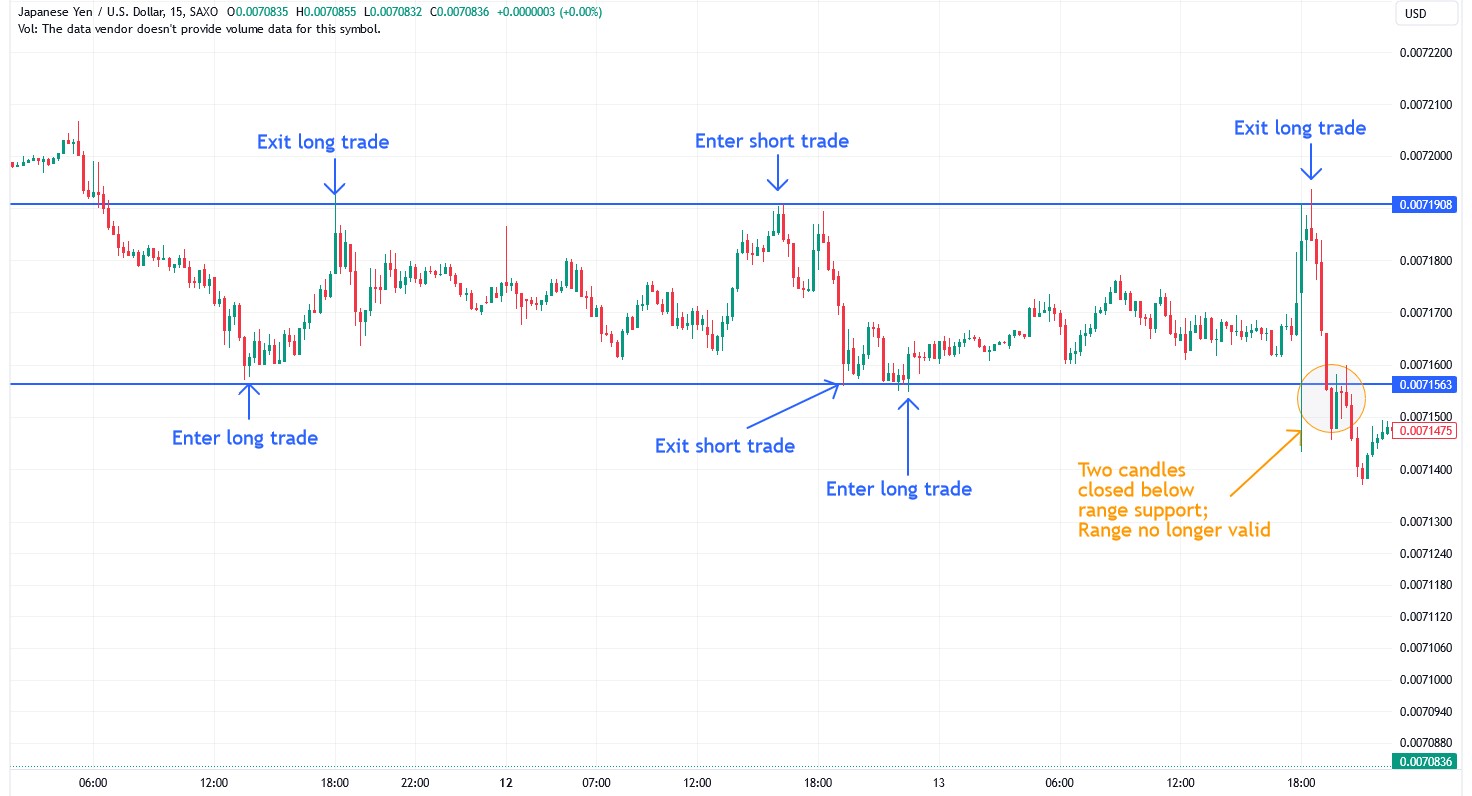
In this chart, we see a classic example of range trading. The market is moving sideways, bouncing between a lower demand area and an upper supply area. At first, the price climbs from the lower zone, giving traders a chance to buy and ride the move up until it reaches the top. At that point, they cash out and maybe even flip to a short trade, riding the move back down. This back-and-forth keeps happening, with traders buying low and selling high. But near the end, things change. The price drops below the lower zone and closes below it twice. This break suggests the range is done, and the market could be gearing up for something different. It’s a reminder that while range trading can be profitable, you always have to watch for signs that the pattern is shifting.
Why supply and demand zones matter
Recognizing these zones on a price chart can offer actionable insights for entry and exit points. Here’s why they’re crucial:
Trend reversals. Supply and demand zones often signal potential trend reversals, especially when accompanied by other indicators.
Trade entries. Trading at these levels may provide higher reward-to-risk ratios, as the price tends to react predictably in these areas.
Stop-loss and take-profit. Strategically placing stop-loss and take-profit orders around these zones can help minimize losses and lock in profits.
Common mistakes to avoid in supply and demand trading
Ignoring market context. Always consider the broader market trend and sentiment; zones are more effective when aligned with the general trend.
Overtrading zones. Not every revisit to a zone warrants a trade. Watch for additional confirmations to improve trade accuracy.
Poor risk management. Supply and demand trading requires well-placed stop-losses, as price movements can sometimes break through these zones unexpectedly.
Tips for beginners
Practice on a demo account. Before trading live, practice spotting and trading supply and demand zones on a demo account. This will help build confidence and refine your strategy without financial risk.
| zForex | Plus500 | OANDA | Trading.com USA | FOREX.com | |
|---|---|---|---|---|---|
|
Demo |
Yes | Yes | Yes | Yes | Yes |
|
Min. deposit, $ |
10 | 100 | No | 50 | 100 |
|
Min Spread EUR/USD, pips |
0.1 | 0.5 | 0.1 | 0.9 | 0.7 |
|
Max Spread EUR/USD, pips |
0.4 | 0.9 | 0.5 | No | 1.2 |
|
Investor protection |
No | €20,000 £85,000 SGD 75,000 | £85,000 SGD 75,000 $500,000 | No | £85,000 |
|
Max. Regulation Level |
Not regulated | Tier-1 | Tier-1 | Tier-1 | Tier-1 |
|
Open an account |
Go to broker Your capital is at risk.
|
Go to broker 80% of retail CFD accounts lose money. |
Go to broker Your capital is at risk. |
Go to broker Your capital is at risk. |
Study review |
Use confluence. Combine supply and demand zones with other indicators like trend lines, moving averages, or Fibonacci retracements to boost accuracy.
Pros and cons
- Pros
- Cons
Clear entry/exit points. Defines precise areas for trades, boosting confidence and accuracy.
Risk management. Enables strategic stop-loss placement, controlling potential losses.
Versatile application. Works across markets and time frames, especially higher ones.
High reward potential. Often provides favorable reward-to-risk ratios.
Simplicity. Focuses analysis on high-probability areas without excessive indicators.
Not always reliable. Price may break zones unexpectedly, leading to losses.
Volatility risks. High volatility can trigger false signals and stop-losses.
Patience required. Waiting for setups can be challenging for impatient traders.
Lower time frame limitations. Weaker signals on lower time frames increase false breakouts.
Market dependency. Effectiveness varies with market conditions, especially during trends or news events.
Risks and warnings
Unpredictable price reactions. While supply and demand zones can indicate potential reversal or continuation points, price does not always react as expected. Sudden market changes from news events or shifts in sentiment can cause the price to break through these zones unexpectedly.
Over-reliance on zones. Relying solely on supply and demand zones without additional confirmation from indicators or price action can lead to false entries or exits. Strong trends may overpower these zones, making them ineffective.
Market volatility. High volatility, especially during major economic announcements, can lead to sharp price spikes that break through zones temporarily. This can trigger stop-loss orders if placed too close to the zone boundaries.
Psychological challenges. Supply and demand trading requires patience and discipline. Emotional trading, impatience, and overtrading can result in poor decisions, particularly if trades are entered without proper confirmation.
Stop-loss placement. Placing stop-losses too close to the zones increases the risk of being stopped out prematurely. Adjusting stop-loss distance according to volatility can help manage this risk.
Wait for clear confirmation before jumping in zone

When approaching a supply or demand zone, just wait for clear confirmation before jumping in. Many traders, especially those new to this concept, rush into trades the moment price reaches a zone. Instead, take the time to observe how the price behaves there. Look for signs of rejection or strong momentum, which can help confirm the trade’s direction.
Also, remember that not all zones are equal; higher time frames generally hold more weight. Daily or weekly zones often provide stronger, more reliable signals compared to lower time frames. Over the years, I've found that combining zones with other technical indicators — like moving averages or volume — can really help filter out weaker setups.
Conclusion
Mastering the identification and application of supply and demand zones can significantly elevate your trading strategy, enabling more precise entries and exits in any market. By recognizing where institutional buying and selling interest congregates—such as a sharp rally from a demand zone or a swift drop from a supply zone—traders can anticipate turning points with greater confidence. For instance, spotting a well-defined demand zone on the EUR/USD pair can offer an optimal entry point ahead of a bullish reversal, while a clear supply zone in a volatile stock can signal timely exits before a downturn. Ultimately, aligning your trades with these pivotal zones transforms reactive trading into proactive, strategic action—putting you ahead in the high-stakes arena of financial markets.
FAQs
How do higher timeframes impact the reliability of supply and demand zones?
What is the role of volume when identifying supply and demand zones?
Why is it important to use additional indicators with supply and demand zones?
What psychological challenges might traders face when using supply and demand zones?
Editors' Top Picks and Insights

SpaceX falls out of orbit: Does anyone still want Musk’s stock?

The crypto IPO problem: How high-profile listings became investor traps

U.S. Bitcoin reserve: Trump’s unrealized crypto promise

Aiming for leadership: Payment giants prepare a new stablecoin

Proof of Reserves: the new standard for cryptocurrency exchanges

Three trends that could reshape the crypto market over the next decade
Related Articles
Team that worked on the article
Maxim Nechiporenko has been a contributor to Traders Union since 2023. He started his professional career in the media in 2006.
Dan Blystone began his trading career in 1998 as an arbitrage clerk on the floor of the Chicago Mercantile Exchange (CME). He later traded bond and Eurex futures at proprietary firms such as Altea Trading, gaining valuable experience in high-frequency trading and risk management.
Chinmay Soni is a financial analyst with more than 5 years of experience in working with stocks, Forex, derivatives, and other assets. As a founder of a boutique research firm and an active researcher, he covers various industries and fields, providing insights backed by statistical data.
An investor is an individual, who invests money in an asset with the expectation that its value would appreciate in the future. The asset can be anything, including a bond, debenture, mutual fund, equity, gold, silver, exchange-traded funds (ETFs), and real-estate property.
Volatility refers to the degree of variation or fluctuation in the price or value of a financial asset, such as stocks, bonds, or cryptocurrencies, over a period of time. Higher volatility indicates that an asset's price is experiencing more significant and rapid price swings, while lower volatility suggests relatively stable and gradual price movements.
Take-Profit order is a type of trading order that instructs a broker to close a position once the market reaches a specified profit level.
Cryptocurrency is a type of digital or virtual currency that relies on cryptography for security. Unlike traditional currencies issued by governments (fiat currencies), cryptocurrencies operate on decentralized networks, typically based on blockchain technology.
Breakout trading is a trading strategy that focuses on identifying and profiting from significant price movements that occur when an asset's price breaches a well-defined level of support or resistance.

-
 Afghanistan
-
 Albania
-
 Algeria
-
 Angola
-
 Argentina
-
 Armenia
-
 Australia
-
 Austria
-
 Azerbaijan
-
 Bahamas
-
 Bahrain
-
 Bangladesh
-
 Belarus
-
 Belgium
-
 Bolivia
-
 Botswana
-
 Brazil
-
 Brunei
-
 Bulgaria
-
 Cambodia
-
 Cameroon
-
 Canada
-
 Chile
Chile
-
 China
China
-
 Colombia
-
 Congo
Congo
-
 Costa Rica
-
 Cote d'Ivoire
-
 Croatia
-
 Cuba
Cuba
-
 Cyprus
-
 Czechia
-
 DR Congo
-
 Denmark
-
 Dominican Republic
-
 Ecuador
-
 Egypt
Egypt
-
 El Salvador
-
 Estonia
-
 Eswatini
-
 Ethiopia
-
 Finland
-
 France
-
 Georgia
-
 Germany
-
 Ghana
Ghana
-
 Greece
-
 Haiti
Haiti
-
 Hong Kong
-
 Hungary
-
 India
India
-
 Indonesia
-
 Iran, Islamic republic
-
 Iraq
Iraq
-
 Ireland
-
 Israel
-
 Italy
Italy
-
 Jamaica
-
 Japan
Japan
-
 Jordan
-
 Kazakhstan
-
 Kenya
Kenya
-
 Korea
Korea
-
 Kuwait
-
 Kyrgyzstan
-
 Laos
Laos
-
 Latvia
-
 Lebanon
-
 Lesotho
-
 Libya
Libya
-
 Lithuania
-
 Luxembourg
-
 Madagascar
-
 Malaysia
-
 Malta
Malta
-
 Mauritius
-
 Mexico
-
 Moldova
-
 Mongolia
-
 Montenegro
-
 Morocco
-
 Mozambique
-
 Myanmar
-
 Namibia
-
 Nepal
Nepal
-
 Netherlands
-
 New Zealand
-
 Nigeria
-
 North Macedonia
-
 Norway
-
 Oman
Oman
-
 Pakistan
-
 Palestine
-
 Panama
-
 Papua New Guinea
-
 Paraguay
-
 Peru
Peru
-
 Philippines
-
 Poland
-
 Portugal
-
 Puerto Rico
-
 Qatar
Qatar
-
 Reunion
-
 Romania
-
 Rwanda
-
 Saudi Arabia
-
 Serbia
-
 Singapore
-
 Slovakia
-
 Slovenia
-
 Somalia
-
 South Africa
-
 Spain
Spain
-
 Sri Lanka
-
 Sweden
-
 Switzerland
-
 Syria
Syria
-
 Taiwan
-
 Tajikistan
-
 Tanzania
-
 Thailand
-
 Trinidad and Tobago
-
 Tunisia
-
 Turkey
-
 UAE
UAE
-
 Uganda
-
 Ukraine
-
 United Kingdom
-
United States
-
 Uruguay
-
 Uzbekistan
-
 Venezuela
-
 Vietnam
-
 Yemen
Yemen
-
 Zambia
-
 Zimbabwe
- Forex
- Crypto
