How To Use The Awesome Oscillator To Spot Early Moves


Editorial Note: While we adhere to strict Editorial Integrity, this post may contain references to products from our partners. Here's an explanation for How We Make Money. None of the data and information on this webpage constitutes investment advice according to our Disclaimer.
The Awesome oscillator is a momentum indicator that compares short-term and long-term price movement using simple moving averages of the median price. It helps spot shifts in market momentum before price reacts, showing when buyers or sellers are gaining strength. By watching the size and direction of the bars, not just the color, you can read the market’s true tempo early.
The Awesome oscillator is more than just bar color flipping back and forth. It shows the pace of the move and helps you spot whether short-term traders are pushing harder than the longer trend allows. What makes it work is how clearly it shows shifts in control without needing extra indicators. Most people jump into the move too late when the bars flip across the zero line. But the real clue comes from how fast the bars grow and how deep they pull back before the flip. That is where you get a read on the market’s mood before it makes a visible move. In this article, we will take a detailed look into the Awesome oscillator, talking about its origin, calculation, strategies, and important tips.
Introduction to Awesome oscillator

The Awesome oscillator is a momentum-based technical indicator that shows you whether the market is currently bullish or bearish. It does this by comparing short-term and long-term market momentum. Instead of following price alone, it looks at how quickly price is moving and whether that pace is building up or slowing down.
This tool appears as a histogram of green and red bars that move above and below a zero line. Green bars show increasing momentum, while red bars show momentum fading. The Awesome oscillator helps traders confirm trends, spot reversals, and avoid jumping into weak trades.
What the Awesome oscillator helps with
Confirms if a trend has strength behind it.
Signals early reversals with momentum shifts.
Helps identify trade setups based on color and bar position.
Can be combined with support and resistance for more precise entries.

Origin and development of Awesome oscillator
The Awesome oscillator was developed by Bill Williams, the same trader behind other indicators like the alligator and the market facilitation index. He introduced it as part of his system for reading the market’s momentum and structure, rather than just relying on price action.
Why it was created
Williams wanted a tool that measured market momentum across multiple timeframes.
He designed it to compare a 5-period and 34-period simple moving average (SMA), calculated from the median price instead of the close.
The oscillator helps traders spot when momentum is rising or falling – even if price is not clearly trending.
How it became popular
It was first introduced in Bill Williams’ books Trading Chaos and New Trading Dimensions.
Traders started using it across different markets, especially stocks, commodities, and indices.
It gained attention for being visual, easy to read, and effective for trend confirmation.
Why it’s still used
Works well in trending and ranging markets.
Helps simplify momentum reading without overloading the chart.
Its visual format (green and red bars) makes it accessible to both new and experienced traders.
Understanding the components of Awesome oscillator
The Awesome oscillator is made up of just a few simple parts, but together they give powerful insight into momentum. It measures the difference between two moving averages and plots the result as green and red bars on a histogram. These bars help traders see whether momentum is building up or slowing down – without needing to interpret complex formulas.
The core formula
At the heart of the Awesome oscillator is a comparison between two simple moving averages (SMAs), calculated from the median price, not the closing price.
Median price = (High + Low) ÷ 2
Awesome oscillator = 5-period SMA − 34-period SMA (of the median price)
When the 5-period SMA is greater than the 34-period SMA, the histogram is above zero (bullish momentum).
When the 5-period SMA is less than the 34-period SMA, the histogram is below zero (bearish momentum).
What the colors mean
The histogram bars change color based on whether the value is rising or falling.
Green bar
The current bar is higher than the previous one. This signals that momentum is increasing in the current direction.Red bar
The current bar is lower than the previous one. This shows that momentum is weakening, even if price is still moving in the same direction.
Interpreting the zero line
The zero line acts as a midpoint. When the bars cross this line, it may suggest a shift in control between buyers and sellers.
A cross above the zero line signals potential bullish momentum.
A cross below the zero line points to possible bearish momentum.
How to set up Awesome oscillator
The Awesome oscillator is easy to find and use on most trading platforms. It’s a built-in indicator that automatically calculates and displays momentum without needing manual input. Once added to your chart, it begins plotting red and green histogram bars around a central zero line.
Access the indicator
Adding the Awesome oscillator to your chart is fast and straightforward.
How to do it
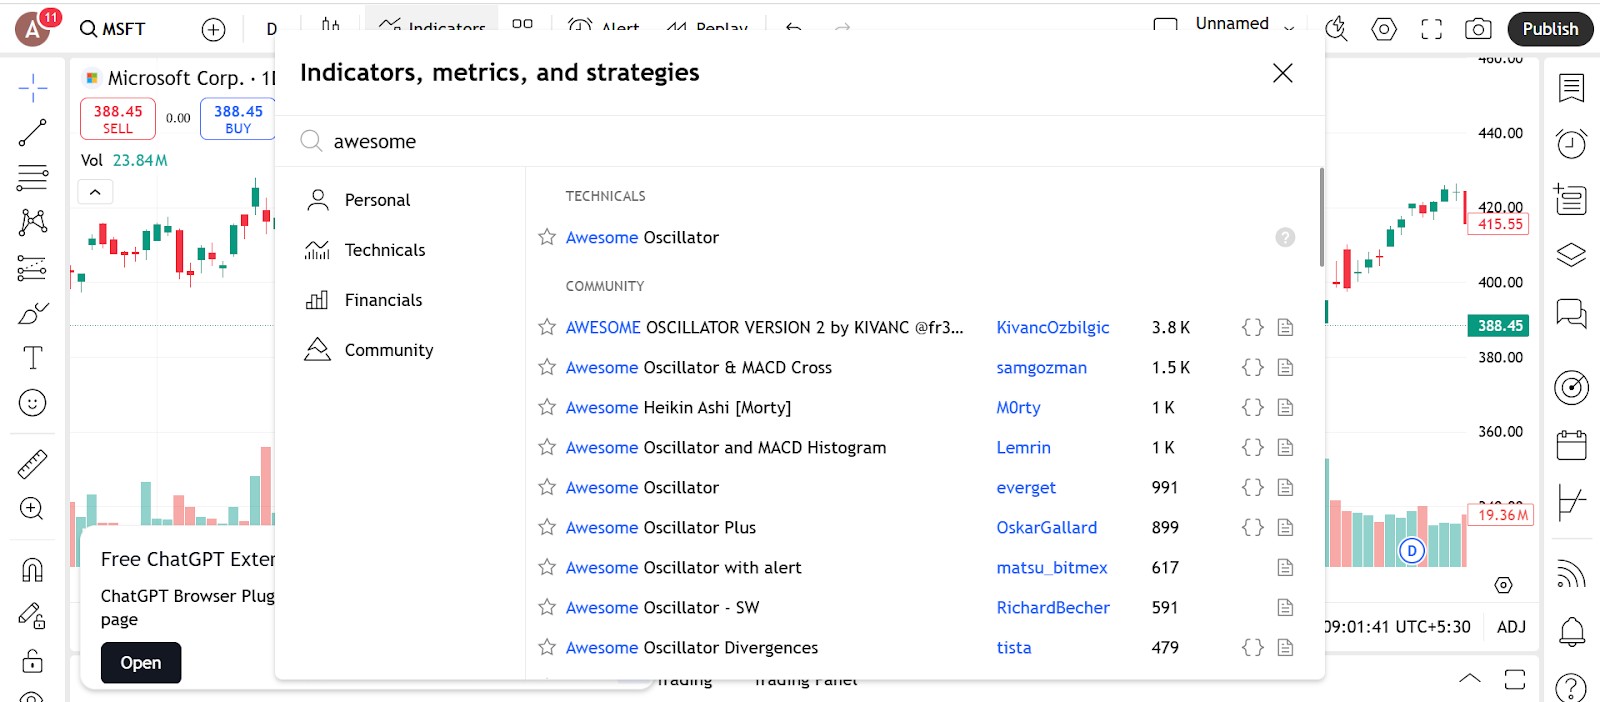
Open the indicators menu in your charting platform.
Type Awesome Oscillator in the search bar.
Click to apply it. The line will appear below your main chart in a separate pane.
Where it’s available
Pre-installed on MetaTrader 4 and 5, TradingView, ThinkorSwim, and most other charting tools.
No external downloads or plug-ins are required.
Configure the parameters
The Awesome oscillator doesn’t come with adjustable calculation inputs. It uses fixed periods, 5 and 34, based on simple moving averages of the median price. However, you can customize the display to suit your chart layout.
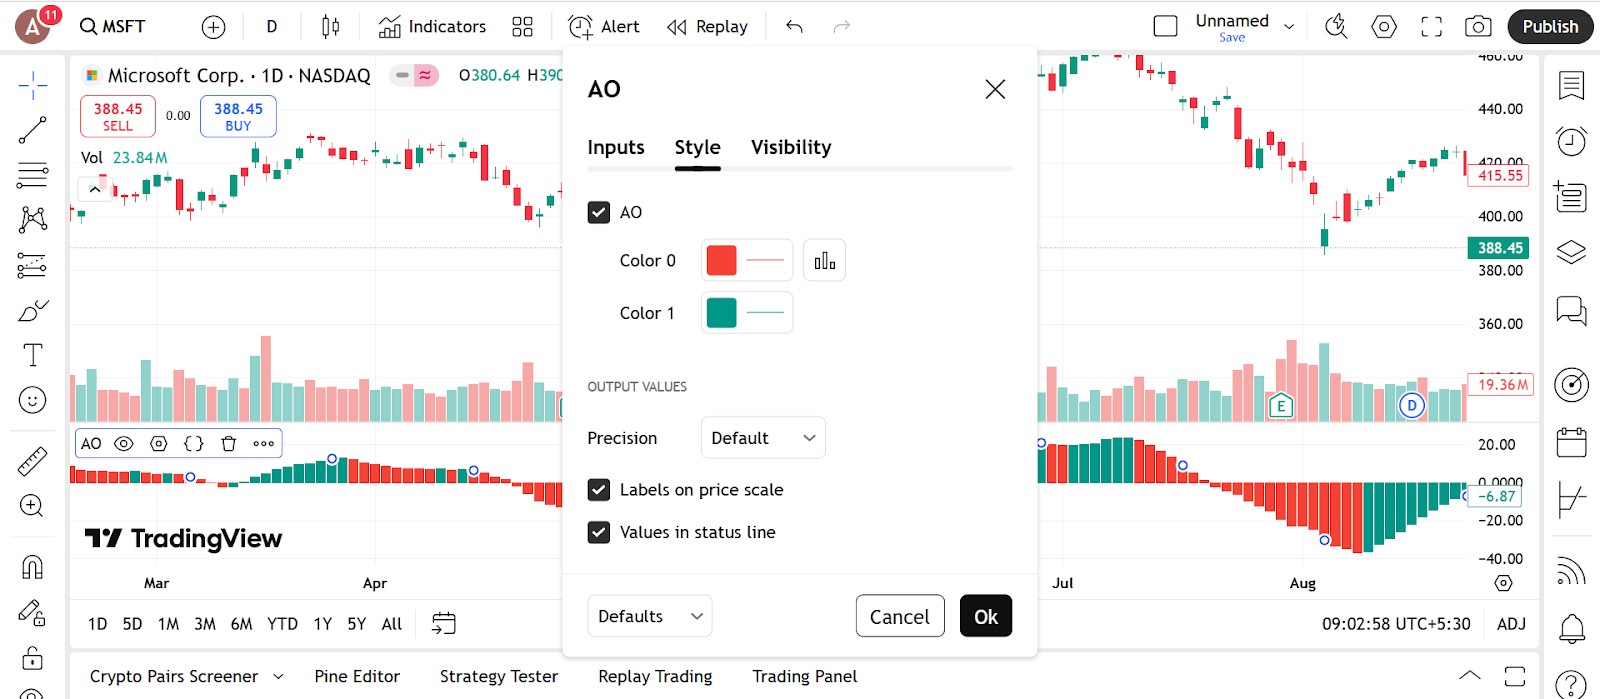
What you can customize
Bar color and style
Adjust the green and red colors for better visibility on your chart theme.Histogram line thickness
Make the bars thinner or thicker depending on your visual preference.Chart area
Choose where the indicator appears – most platforms default it to a panel below your price chart.
Setup tips
Keep the default values unless your platform allows custom code.
Match the color scheme with your existing indicators for clarity.
Combine the indicator with trendlines, support and resistance, or moving averages for stronger setups.
Trading strategies using Awesome oscillator
The Awesome oscillator is especially useful for trend confirmation and catching early signs of reversals. Because it shows momentum visually with green and red bars, it’s easy to read and apply in real trades. Here are some of the best trading strategies using the Awesome oscillator:
Zero line crossover strategy

This is one of the simplest ways to use the Awesome oscillator. It signals a shift in momentum as the bars cross the center line.
How to apply it
If the histogram moves above zero, it suggests bullish momentum.
If it drops below zero, it points to bearish momentum.
Use this as a confirmation tool after a breakout or trendline break.
Combine it with support or resistance levels for better entries.
Why it works
Helps you follow momentum instead of fighting it.
Adds confidence to breakout trades.
Avoids entering during unclear moves.
Twin peaks strategy

This setup looks for two peaks (or valleys) in the histogram to spot potential reversals before price reacts.
How to apply it
For a bullish signal, look for two red peaks below zero where the second is smaller and followed by a green bar.
For a bearish signal, look for two green peaks above zero with the second one lower, followed by a red bar.
This pattern often shows fading strength before a turn.
Why it works
Catches signs that the current trend is losing steam.
Helps time early entries or plan for a shift.
Useful in both trending and ranging markets.
Saucer strategy

This strategy helps spot short pauses in the trend before momentum picks up again.
How to apply it
In a bullish setup, look for three bars above zero: two red bars followed by a green one.
In a bearish setup, look for three bars below zero: two green bars followed by a red one.
Enter in the direction of the new bar if it confirms the trend’s continuation.
Why it works
Helps you enter a trend after a quick pullback.
Adds structure to momentum-based trades.
Works well with moving average support or resistance.
Divergence strategy

Use the Awesome oscillator to spot divergence between price and momentum.
How to apply it
If price makes a new high but the oscillator forms a lower high, that’s bearish divergence.
If price makes a new low but the oscillator forms a higher low, that’s bullish divergence.
Wait for the bars to confirm a change before entering.
Why it works
Gives early signs of a possible reversal.
Useful at key support and resistance areas.
Adds an extra layer of confirmation to your setup.
Traders who rely heavily on technical indicators will benefit from brokers that are compatible with advanced platforms such as cTrader, MetaTrader 5 (MT5), or TradingView. These platforms come equipped with a comprehensive suite of tools designed for in-depth analysis and strategy execution. To help you find the right fit, we've outlined a selection of top brokers that offer access to these platforms, so you can choose the one that aligns best with your trading goals.
| iBroker | Pepperstone | Fusion Markets | FxPro | IC.com | |
|---|---|---|---|---|---|
|
Currency pairs |
120 | 90 | 90 | 70 | 61 |
|
Crypto |
Yes | Yes | Yes | Yes | Yes |
|
Stocks |
Yes | Yes | Yes | Yes | Yes |
|
Min. deposit, $ |
1 | No | 1 | 100 | 200 |
|
TradingView |
Yes | Yes | Yes | No | Yes |
|
MT5 |
Yes | Yes | Yes | Yes | Yes |
|
cTrader |
Yes | Yes | Yes | Yes | Yes |
|
Open an account |
Study review | Go to broker Your capital is at risk.
|
Go to broker Your capital is at risk. |
Go to broker Your capital is at risk. |
Go to broker Your capital is at risk. |
Why trust us
15+ years of independent market analysis
140+ evaluation criteria, reviewed by 50+ experts
Data-driven reviews of 200+ platforms, updated regularly
20+ industry awards & a wide network of global media partners
Learn more about our methodology and editorial policies.


Pros and cons of Awesome oscillator
- Pros
- Cons
Easy to read and beginner-friendly. The histogram format makes it simple to interpret. Green bars mean momentum is rising, and red bars show it’s slowing. This visual layout helps new traders grasp market shifts quickly.
Confirms trends and signals fading strength. The Awesome oscillator shows whether a move is gaining or losing steam. It confirms trends and helps spot when a rally or selloff might be losing power, giving traders time to plan their next move.
Supports various trading strategies. From crossover setups to divergence and saucer patterns, the indicator adapts to many styles. It works across multiple timeframes and markets, including stocks, indices, and commodities.
Works well with other tools. The Awesome oscillator pairs nicely with trendlines, moving averages, or support and resistance. It acts as a confirmation layer without cluttering your chart.
Lagging by nature. Since it’s based on moving averages, it reacts after the price has already started moving. This means you might miss the earliest part of a breakout or reversal.
May produce false signals in choppy markets. In sideways or low-volume conditions, the indicator can flip between red and green without meaningful movement. This may lead to confusion or poorly timed trades.
No built-in buy or sell alerts. It shows momentum changes, but it doesn’t say exactly when to enter or exit. Traders still need to rely on chart context or other tools for entry timing.
Less effective on short timeframes. On lower time frames, the signals become more sensitive and less reliable. It may respond to noise rather than actual trend shifts, especially during news events or sudden spikes.
Bar size reveals strength, not just color direction

What new traders usually lock onto with the Awesome oscillator is the bar color. But the real detail to track is the spacing and size. If green bars are getting taller and spreading out fast, short-term buyers are stepping up. But if the bars turn green and just sit there, the move is soft. The color shows direction. The size shows strength. Changing this one habit helps you avoid weak setups and only follow momentum when it is backed by real push.
Also, sometimes the bars flip from red to green but price does not respond much. That is not a breakout – it is pressure building under the surface. These quiet flips often turn into sharp action once price catches up. The Awesome oscillator is not just for clean entries. It is for catching the tempo of the market and getting in before others wake up to what is shifting.
Conclusion
Mastering the Awesome Oscillator can give traders a distinct edge by highlighting genuine momentum shifts ahead of visible price action. By using clear signals—such as the zero line crossover and twin peaks—traders can enter high-probability trades while avoiding common pitfalls associated with weak trend confirmation. For instance, catching a bullish crossover early or sidestepping a false breakout becomes far more achievable with this tool. Ultimately, the Awesome Oscillator isn't just another indicator—it's a strategic lens that allows traders to anticipate rather than react. Embrace its insights, and let momentum guide you to smarter, more confident trading decisions.
FAQs
How do you interpret the size and spacing of Awesome Oscillator bars for better trade decisions?
What visual cues from the Awesome Oscillator signal potential reversals before price reacts?
In what trading conditions does the Awesome Oscillator produce less reliable signals?
Can you customize the Awesome Oscillator settings to fit different strategies?
Editors' Top Picks and Insights

SK Hynix debuts on Nasdaq: Largest U.S. offering by foreign company

SpaceX falls out of orbit: Does anyone still want Musk’s stock?

The crypto IPO problem: How high-profile listings became investor traps

U.S. Bitcoin reserve: Trump’s unrealized crypto promise

Aiming for leadership: Payment giants prepare a new stablecoin

Proof of Reserves: the new standard for cryptocurrency exchanges
Related Articles
Team that worked on the article
Anton Kharitonov is an active trader and analyst. He employs both short- and long-term trading strategies, primarily based on fundamental factors, supported by technical indicators and intermarket analysis.
Dan Blystone began his trading career in 1998 as an arbitrage clerk on the floor of the Chicago Mercantile Exchange (CME). He later traded bond and Eurex futures at proprietary firms such as Altea Trading, gaining valuable experience in high-frequency trading and risk management.
Chinmay Soni is a financial analyst with more than 5 years of experience in working with stocks, Forex, derivatives, and other assets. As a founder of a boutique research firm and an active researcher, he covers various industries and fields, providing insights backed by statistical data.
Forex trading, short for foreign exchange trading, is the practice of buying and selling currencies in the global foreign exchange market with the aim of profiting from fluctuations in exchange rates. Traders speculate on whether one currency will rise or fall in value relative to another currency and make trading decisions accordingly. However, beware that trading carries risks, and you can lose your whole capital.
Ranging markets are a type of market characterized by short-term movement between apparent asset price highs and lows.
Day trading involves buying and selling financial assets within the same trading day, with the goal of profiting from short-term price fluctuations, and positions are typically not held overnight.
An investor is an individual, who invests money in an asset with the expectation that its value would appreciate in the future. The asset can be anything, including a bond, debenture, mutual fund, equity, gold, silver, exchange-traded funds (ETFs), and real-estate property.
Trading divergence in Forex involves identifying when the price of a currency pair and an oscillator (such as RSI, MACD, or Stochastic) move in opposite directions, indicating potential trend reversals or continuations.

-
 Afghanistan
-
 Albania
-
 Algeria
-
 Angola
-
 Argentina
-
 Armenia
-
 Australia
-
 Austria
-
 Azerbaijan
-
 Bahamas
-
 Bahrain
-
 Bangladesh
-
 Belarus
-
 Belgium
-
 Bolivia
-
 Botswana
-
 Brazil
-
 Brunei
-
 Bulgaria
-
 Cambodia
-
 Cameroon
-
 Canada
-
 Chile
Chile
-
 China
China
-
 Colombia
-
 Congo
Congo
-
 Costa Rica
-
 Cote d'Ivoire
-
 Croatia
-
 Cuba
Cuba
-
 Cyprus
-
 Czechia
-
 DR Congo
-
 Denmark
-
 Dominican Republic
-
 Ecuador
-
 Egypt
Egypt
-
 El Salvador
-
 Estonia
-
 Eswatini
-
 Ethiopia
-
 Finland
-
 France
-
 Georgia
-
 Germany
-
 Ghana
Ghana
-
 Greece
-
 Haiti
Haiti
-
 Hong Kong
-
 Hungary
-
 India
India
-
 Indonesia
-
 Iran, Islamic republic
-
 Iraq
Iraq
-
 Ireland
-
 Israel
-
 Italy
Italy
-
 Jamaica
-
 Japan
Japan
-
 Jordan
-
 Kazakhstan
-
 Kenya
Kenya
-
 Korea
Korea
-
 Kuwait
-
 Kyrgyzstan
-
 Laos
Laos
-
 Latvia
-
 Lebanon
-
 Lesotho
-
 Libya
Libya
-
 Lithuania
-
 Luxembourg
-
 Madagascar
-
 Malaysia
-
 Malta
Malta
-
 Mauritius
-
 Mexico
-
 Moldova
-
 Mongolia
-
 Montenegro
-
 Morocco
-
 Mozambique
-
 Myanmar
-
 Namibia
-
 Nepal
Nepal
-
 Netherlands
-
 New Zealand
-
 Nigeria
-
 North Macedonia
-
 Norway
-
 Oman
Oman
-
 Pakistan
-
 Palestine
-
 Panama
-
 Papua New Guinea
-
 Paraguay
-
 Peru
Peru
-
 Philippines
-
 Poland
-
 Portugal
-
 Puerto Rico
-
 Qatar
Qatar
-
 Reunion
-
 Romania
-
 Rwanda
-
 Saudi Arabia
-
 Serbia
-
 Singapore
-
 Slovakia
-
 Slovenia
-
 Somalia
-
 South Africa
-
 Spain
Spain
-
 Sri Lanka
-
 Sweden
-
 Switzerland
-
 Syria
Syria
-
 Taiwan
-
 Tajikistan
-
 Tanzania
-
 Thailand
-
 Trinidad and Tobago
-
 Tunisia
-
 Turkey
-
 UAE
UAE
-
 Uganda
-
 Ukraine
-
 United Kingdom
-
United States
-
 Uruguay
-
 Uzbekistan
-
 Venezuela
-
 Vietnam
-
 Yemen
Yemen
-
 Zambia
-
 Zimbabwe
- Forex
- Crypto
