How To Use Volume Indicator To Read Market Sentiment


Editorial Note: While we adhere to strict Editorial Integrity, this post may contain references to products from our partners. Here's an explanation for How We Make Money. None of the data and information on this webpage constitutes investment advice according to our Disclaimer.
Volume tells the story behind every price move. It shows whether traders are truly behind the breakout or if it's just a quiet drift. When volume breaks its own rhythm, that’s your clue that something bigger is building. Smart traders look beyond the candles — they watch when price and volume stop agreeing. That’s where the real trade setups begin to form.
Volume is not just something you use to double-check price action. It tells you what is really driving the trade. A breakout on average volume might look good but it is like a car rolling downhill with no engine. You see the real action when volume breaks its own rhythm, not just when price moves. When you start looking at volume as the story behind the candles, not just a basic tool to tick off you begin to catch what is off before others do. The most interesting trades show up when price and volume do not match and you are sharp enough to spot it.
Understanding the volume indicator
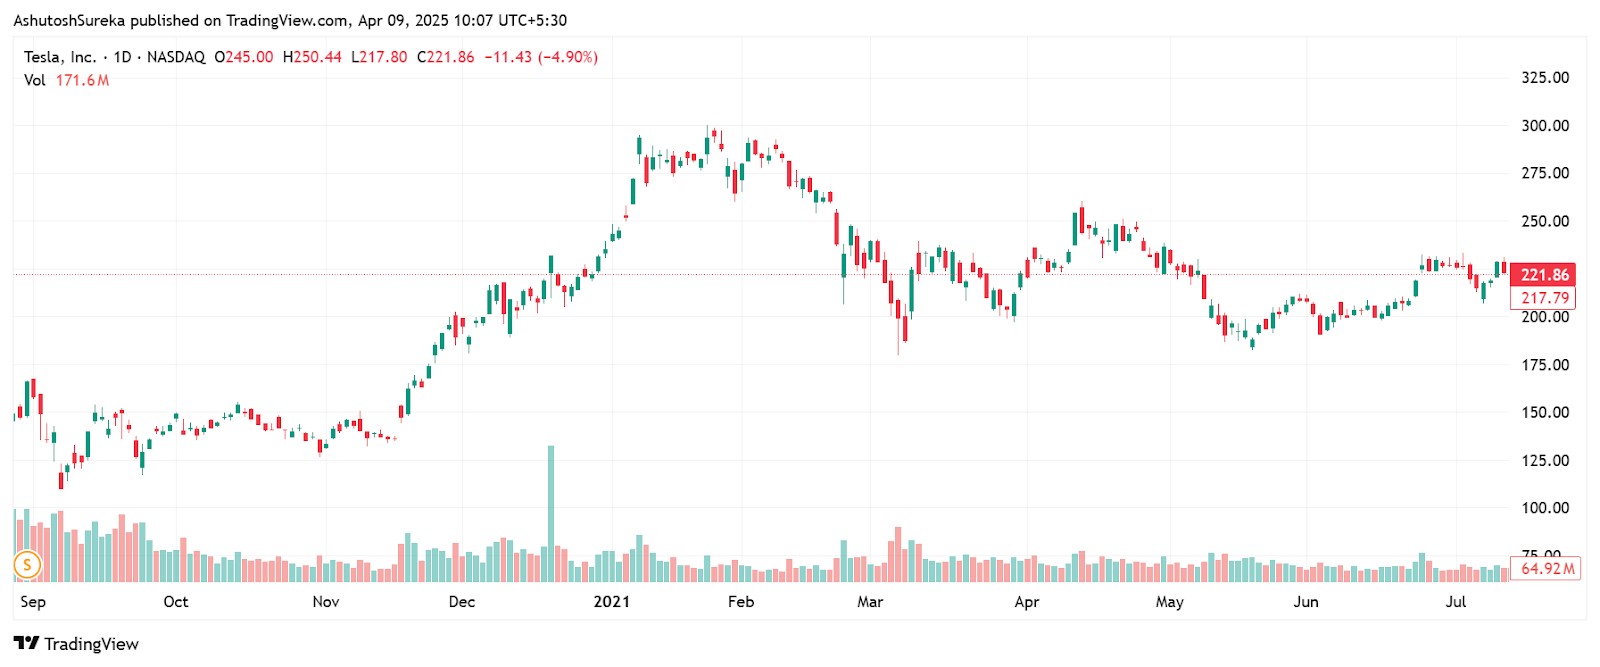
Volume helps traders see how active a stock or market is. They track how many shares or contracts are being traded over time. For beginners, learning about volume is an important step because it helps make sense of what is happening behind price moves. When you pair volume with price trends, you can better understand how traders are reacting and where the market might go next.
Common volume indicators traders use
On balance volume (OBV). This indicator adds volume on up days and subtracts it on down days. It helps spot when buying or selling is picking up.
Volume moving average. Looks at recent average volume and helps traders notice when volume suddenly jumps or drops.
Chaikin money flow (CMF). Combines price and volume to show whether money is flowing into or out of a stock.
Accumulation distribution line (ADL). Measures whether people are quietly buying or selling. A rising line means more buying over time.
Volume price trend (VPT). Adds volume and price movement together to show the strength behind a price direction.
What volume reveals about market behavior
Volume tells you how many people are involved and how strongly they feel about a price move. When volume goes up, it means more traders are jumping in. When volume drops, interest may be fading. Learning how to spot these signs helps beginners avoid traps and make more confident trading decisions.
Buying and selling pressure
Volume gives hints about whether buyers or sellers are in charge.
What strong buying looks like
Volume picks up as price climbs.
Big green candles show up with high volume.
Breakouts happen with a burst of volume.
What strong selling looks like
Price falls with rising volume.
Red candles appear near the top of a trend.
Breakouts fail and volume spikes at the same time.
How to read pressure better
Look at volume over different time frames to see the full picture.
Match volume with key price levels.
Notice when price and volume don’t move together.
Volume as a confirmation tool
Volume backs up what price is doing. If price moves but volume stays flat, something might be off. But if volume joins the move, the signal is usually stronger.
Confirming a breakout
Strong breakouts often come with heavy volume.
Weak volume breakouts are more likely to fail.
Watch volume at key support and resistance areas.
Checking trend strength
In uptrends, volume should rise when price moves up and slow down when it pulls back.
In downtrends, volume rises on drops and fades on small bounces.
Spotting false moves
Be careful when volume doesn’t match the price move.
If volume and price go in different directions, a reversal might be near.
Understanding the volume indicator formula
To truly grasp how volume indicators work, it helps to understand the basic formulas behind them. Most volume indicators use simple math to combine price movement with trading activity, giving traders a clearer picture of what's happening beneath the surface.
On balance volume (OBV) formula
If today’s close is higher than yesterday’s, OBV = previous OBV + today’s volume
If today’s close is lower, OBV = previous OBV - today’s volume
If the close is unchanged, OBV stays the same
This simple formula adds or subtracts volume based on price direction. The goal is to track whether volume is supporting the trend.
Volume price trend (VPT) formula
VPT = previous VPT + (volume × (close − previous close) ÷ previous close)
This one adjusts volume by the size of the price change. It helps weigh the significance of a move, especially during big price swings.
Forex volume indicator
Volume in Forex is a bit different than in stocks or crypto. Since the market is decentralized, there is no official source of true volume. However, traders have found ways to use what’s available effectively.
Understanding Forex volume
What most Forex platforms call "volume" is actually tick volume.
Despite its limitations, tick volume often mirrors actual trade volume trends.
Studies have shown a strong correlation between tick volume and real volume in Forex.
Popular Forex volume indicators
Tick volume. Shows how many times the price changed. Higher tick volume means more active trading periods.
Volume profile. A more advanced tool found in some platforms. It shows how much trading happened at different price levels.
Volume weighted average price (VWAP). Combines volume and price to show the average traded price. Helps identify fair value zones in trending or sideways markets.
How to set up volume indicator
Before using volume to support your trades, you need to add it to your chart. Most platforms make this quick and simple. Once it’s there, a few small adjustments can make it easier to read and more helpful for your trading style.
Access the indicator
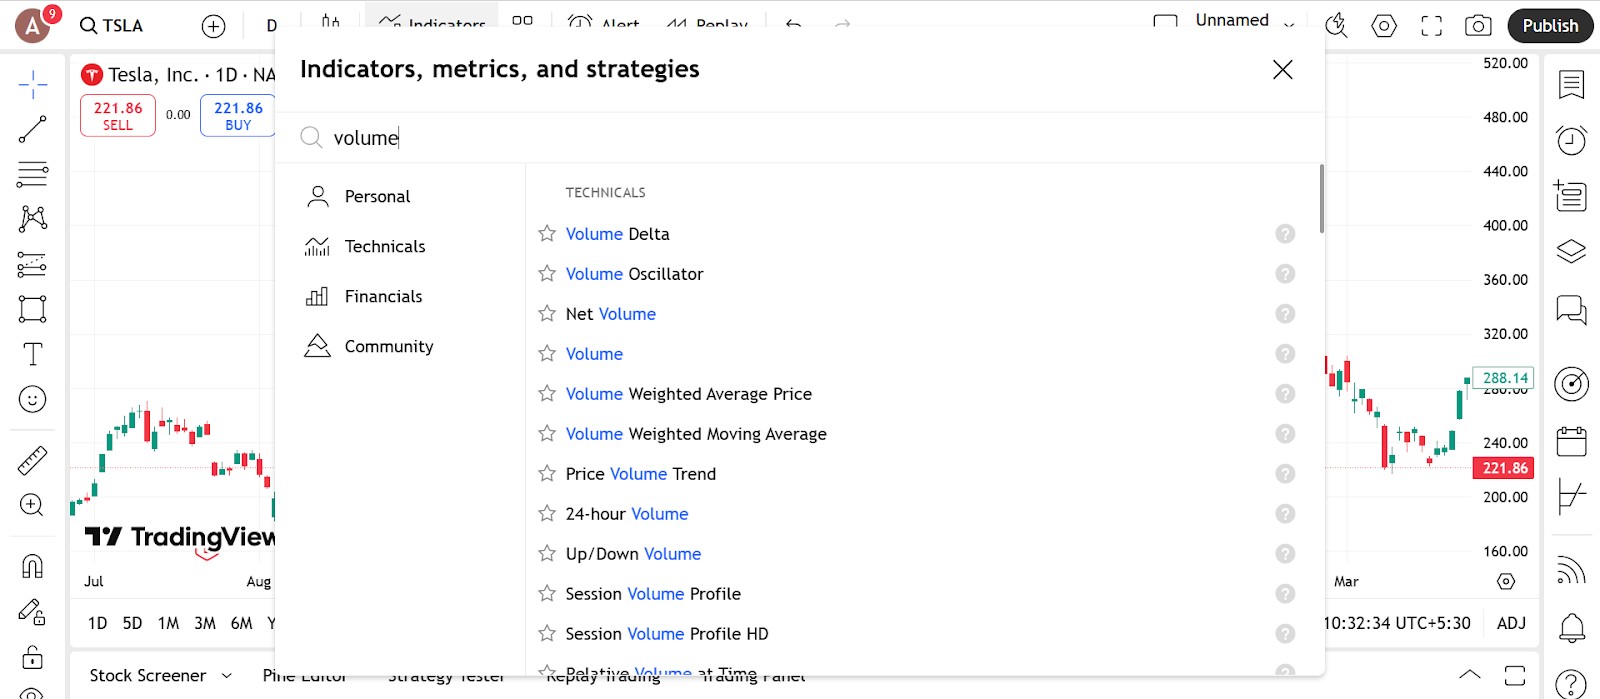
Adding the volume indicator to your chart is fast and straightforward.
How to do it
Open the indicators menu in your charting platform.
Type volume in the search bar.
Click to apply it — the line will appear below your main chart in a separate pane.
Where it’s available
Pre-installed on TradingView, MetaTrader 4 and 5, ThinkorSwim, and most other charting tools.
No external downloads or plug-ins are required.
Configure the parameters
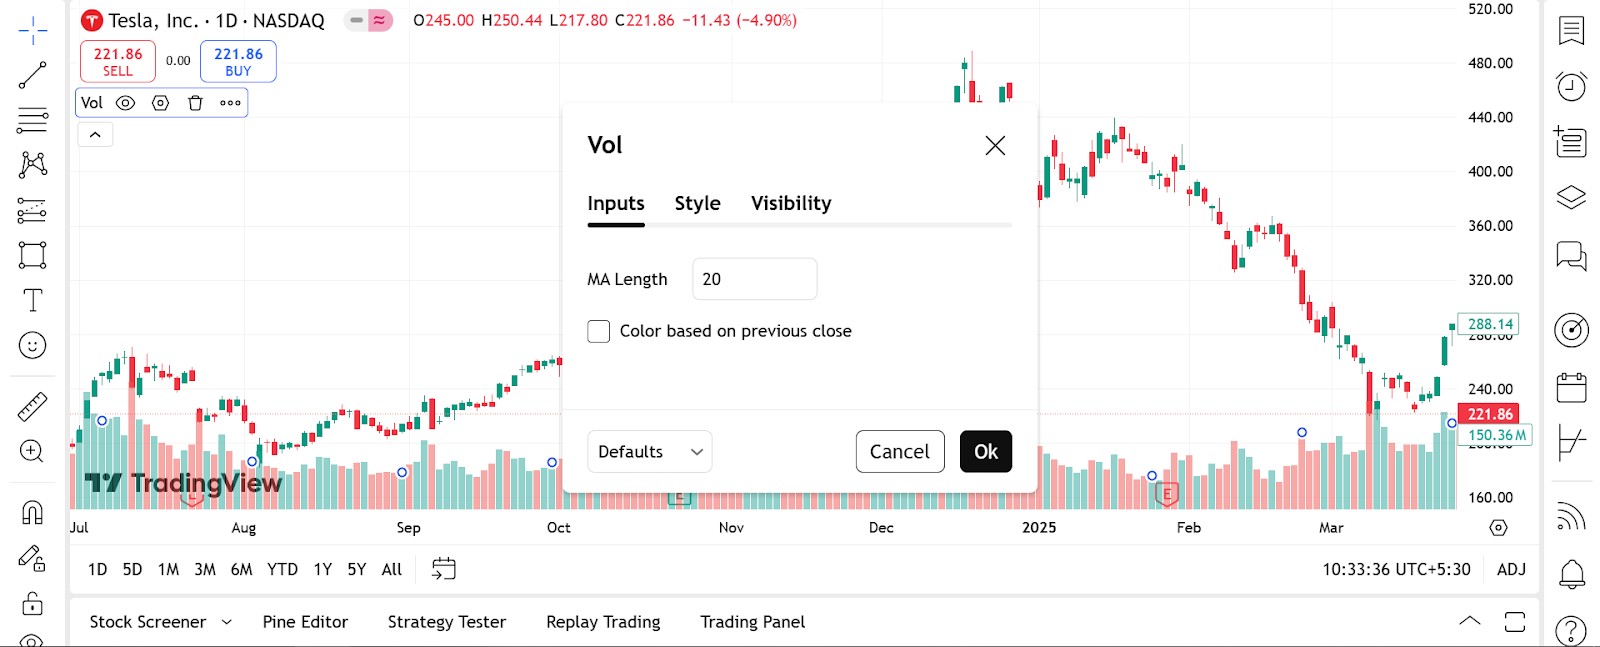
Once the volume tool is on your screen, you can change a few settings to make it easier to use.
What you can change
Period. Pick how many bars the indicator should look at. A short period reacts faster. A long one gives a smoother view.
Colors. You can set different colors for rising and falling volume. This makes it easier to see what’s going on at a glance.
View style. Choose whether the volume shows as bars, lines, or a filled area. Pick what feels easiest on your eyes.
Trading strategies using volume indicator
Volume indicators can be powerful tools when used in the right trading strategies. By paying attention to how volume behaves during different market conditions, traders can spot entries, confirm breakouts, and avoid false moves. Volume adds another layer of confidence to your trading plan, especially when combined with price action and trend analysis.
Breakout confirmation strategy
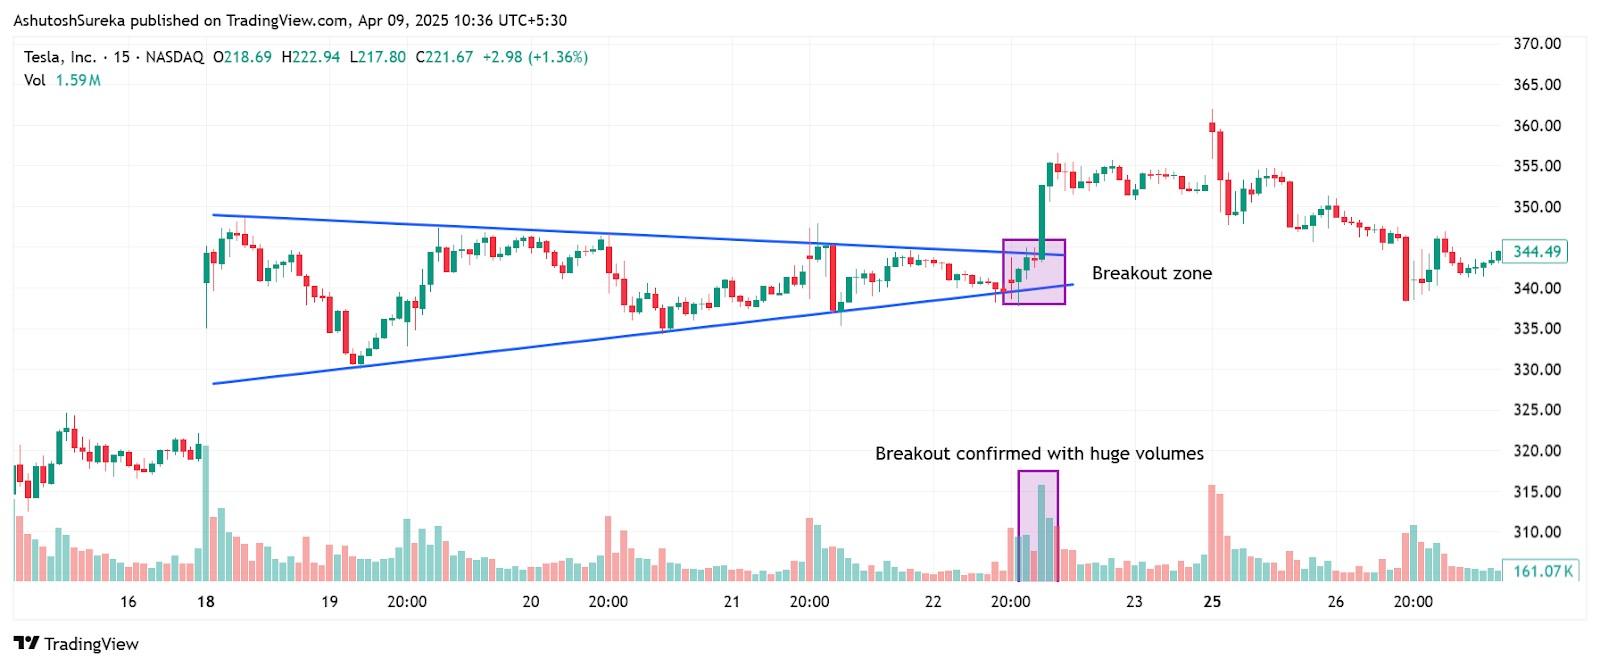
One of the most common uses of volume is to confirm a breakout. When price breaks through a key level, volume should increase. If it doesn’t, the breakout may be weak or short-lived.
How to apply it
Identify major support or resistance zones.
Wait for price to close above or below the level.
Check if volume spikes during the breakout candle.
Enter the trade only if volume confirms the move.
Why it works
High volume shows strong interest and participation.
Low volume during a breakout often leads to quick reversals.
Helps filter out fake breakouts or market noise.
Volume pullback entry strategy
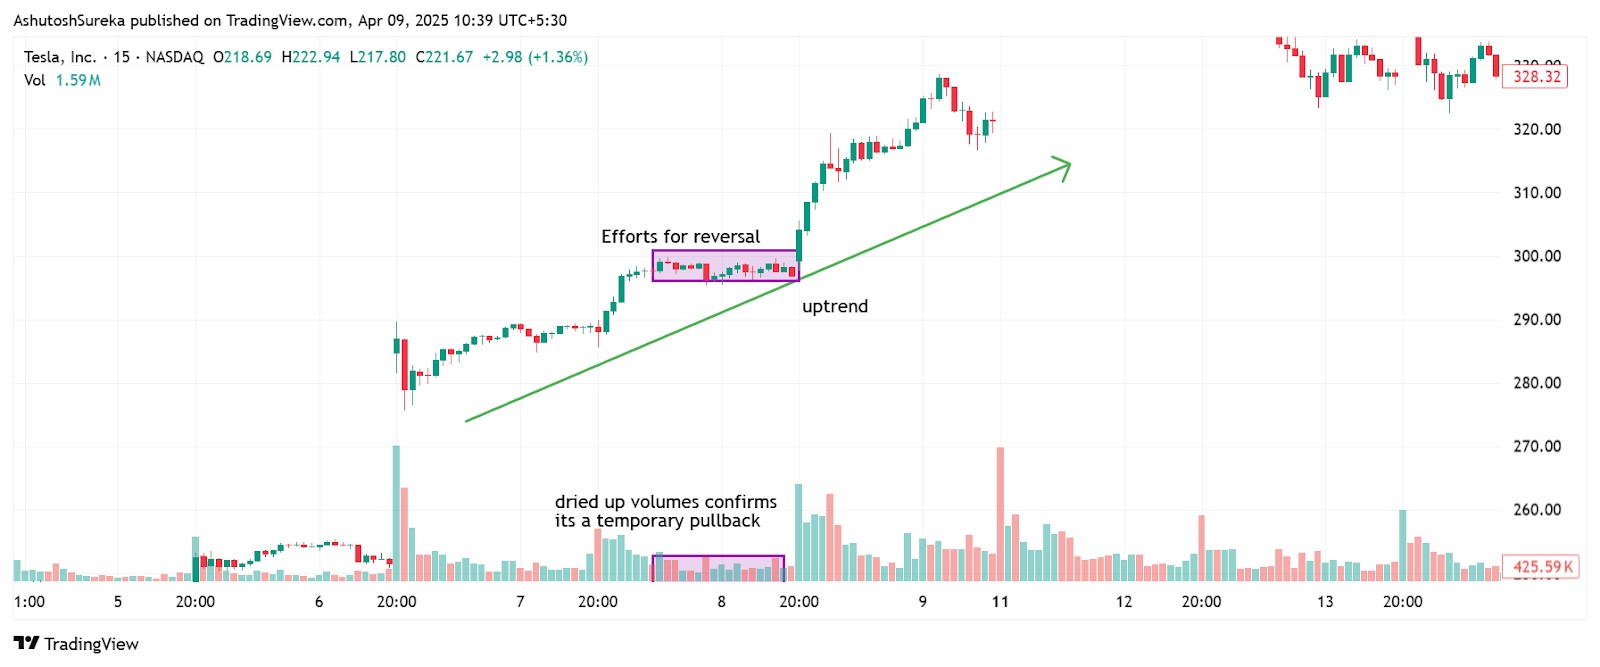
This strategy uses volume to time entries after a trend has already started. When price pulls back slightly but volume dries up, it often signals that the trend is about to resume.
How to apply it
Identify a clear uptrend or downtrend.
Watch for a small pullback against the trend.
Look for lower volume during the pullback compared to the trend move.
Enter when price shows signs of bouncing back in the trend direction.
Why it works
Weak volume on the pullback shows that the counter move lacks strength.
When price resumes with increased volume, it confirms the trend is back on track.
This approach helps you join strong trends without chasing.
Volume divergence strategy
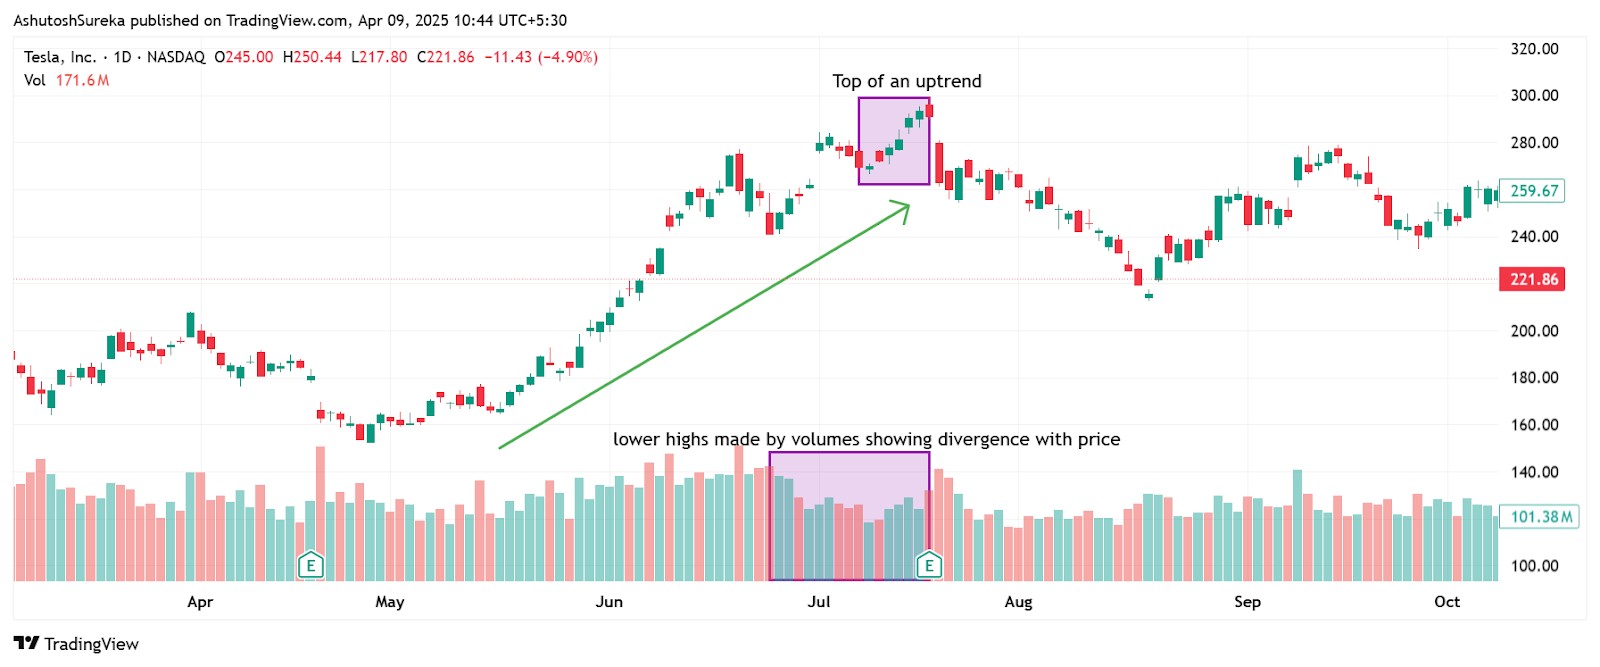
Divergence between price and volume can hint at a reversal. If price keeps making new highs but volume falls, it may signal a loss of momentum.
How to apply it
Track both price action and volume.
Watch for price making higher highs while volume makes lower highs.
This mismatch often appears near the end of a trend.
Look for reversal patterns or candlestick confirmations to enter.
Why it works
Volume should support price movement.
When price rises on falling volume, fewer traders are buying into the move.
It often signals that buyers are losing interest.
Reversal spotting with volume spikes
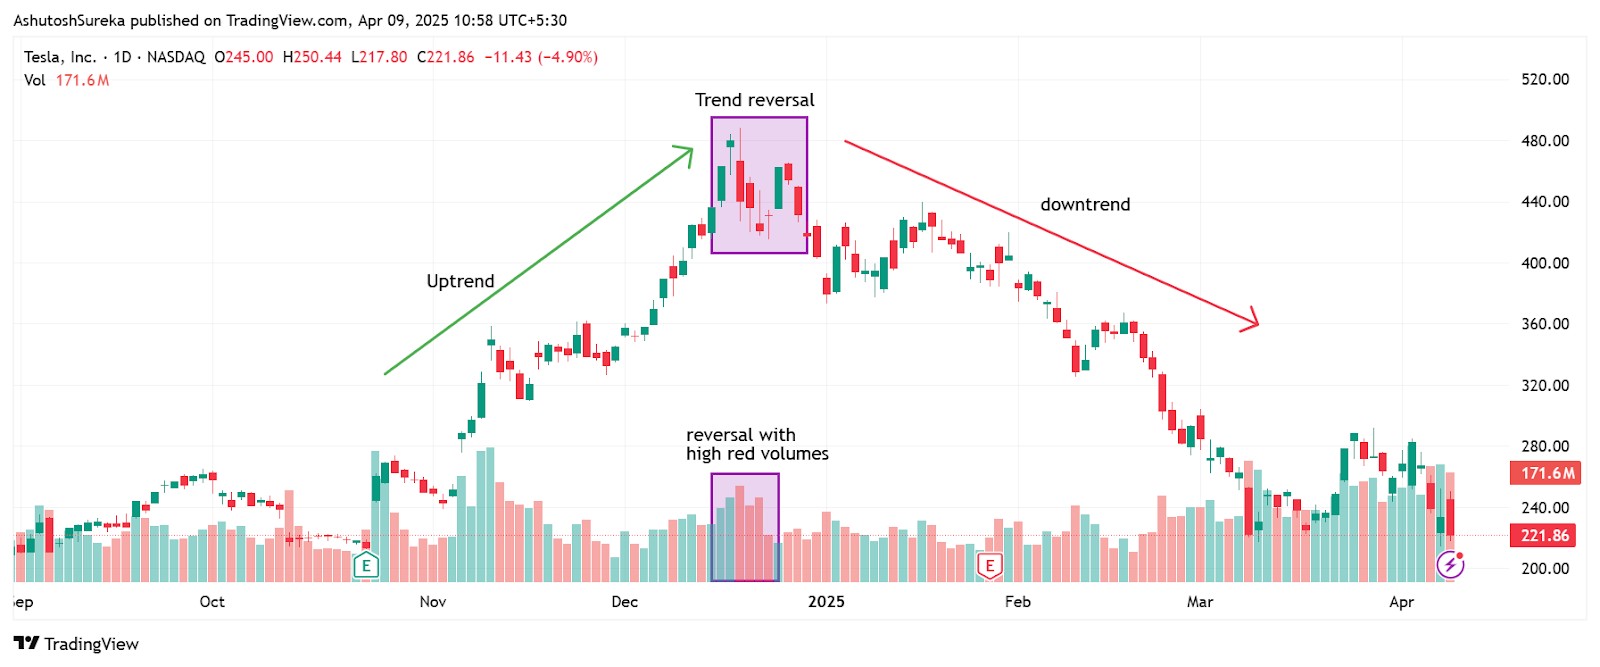
Unusually high volume can point to a change in market direction, especially after a long trend. These spikes often happen at key turning points.
How to apply it
Look for a volume spike after a strong uptrend or downtrend.
Combine with reversal patterns like engulfing candles or double tops.
Use confirmation from other indicators or moving averages before entering.
Why it works
Volume spikes show strong activity, often from institutional traders.
These events can signal profit-taking or a shift in control between buyers and sellers.
Helps catch early signs of a trend change.
If your trading strategy requires the use of many technical indicators, using a broker that supports TradingView, MT5, or cTrader can make your life easier. These tools provide access to a wide range of technical tools, covering almost all the strategies you can think of. In the table below, we have presented the top brokers with access to the abovementioned platforms. You can compare them and choose the best one for yourself:
| Currency pairs | Crypto | Stocks | Min. deposit, $ | Max. leverage | TradingView | MT5 | cTrader | Regulation | TU overall score | Open an account | |
|---|---|---|---|---|---|---|---|---|---|---|---|
| 90 | Yes | Yes | No | 1:500 | Yes | Yes | Yes | ASIC, FCA, DFSA, BaFin, CMA, SCB, CySec | 7.17 | Open an account Your capital is at risk.
|
|
| 52 | Yes | Yes | 25 | 1:1000 | No | Yes | Yes | MISA, FSC (Mauritius) | 8.2 | Open an account Your capital is at risk. |
|
| 70 | Yes | Yes | 100 | 1:500 | No | Yes | Yes | FCA, CYSEC, FSCA, SCB, FSA (Seychelles) | 7.9 | Open an account Your capital is at risk. |
|
| 56 | Yes | Yes | 50 | 1:1000 | No | Yes | Yes | CySEC, FSC (Mauritius), SVG FSA | 7.87 | Open an account Your capital is at risk. |
|
| 61 | Yes | Yes | 200 | 1:500 | Yes | Yes | Yes | ASIC, CySEC, and FSA | 7.46 | Open an account Your capital is at risk. |
Why trust us
We at Traders Union have analyzed financial markets for over 14 years, evaluating brokers based on 250+ transparent criteria, including security, regulation, and trading conditions. Our expert team of over 50 professionals regularly updates a Watch List of 500+ brokers to provide users with data-driven insights. While our research is based on objective data, we encourage users to perform independent due diligence and consult official regulatory sources before making any financial decisions.
Learn more about our methodology and editorial policies.
Pros and cons of using volume indicator
- Pros
- Cons
It confirms the strength behind a trend. When volume rises during an uptrend or downtrend, it shows that more traders are jumping in, adding credibility and momentum to the move.
It helps you filter real breakouts from fake ones. A breakout backed by strong volume is more likely to stick. If there’s no volume behind the move, it’s often just noise.
It gives insight into whether a move has real support. Big price shifts mean a lot more when volume is high. Low-volume moves can be weak and easily reversed.
It works everywhere, even in Forex. Even though Forex doesn’t have true volume data, tick volume still offers solid clues about activity and can be just as useful for spotting momentum shifts.
It needs support from other tools. Volume alone doesn’t give clear signals. To use it effectively, you’ll want to pair it with trendlines, support/resistance zones, or candlestick patterns to add proper context.
It doesn’t show who’s in control. Volume tells you how much is being traded, but not whether it’s mostly buyers or sellers. You still have to read the price action to understand the intent behind the moves.
It can lag or vary across platforms. Volume sometimes reacts after the move is underway, especially during news spikes. Plus, different platforms display volume differently, which can impact how you interpret it.
The story volume tells when price looks too perfect

A small detail most people miss with volume is when price looks smooth but volume is just flat. A clean breakout with no volume is not strength. It is just price moving because nothing is in the way. That is your early warning. Most people see a move and chase it. But if the volume is not there you are looking at a push that has no fuel. Go against weak breakouts by betting against soft buying. You are not shorting the chart. You are fading a move that is not backed up.
Another thing most traders ignore is how volume shows up around failed levels. Watch when price breaks through support or resistance then comes back to test it. If volume spikes on the retest and price still cannot reclaim the level that rejection means something. Bigger players probably used that bounce to sell into the buyers. You are not just looking at volume size. You are seeing the real story. The volume that spikes on rejection says more than the candles. Do not wait for confirmation. Catch those signs of doubt as they happen.
Conclusion
Volume is not just an extra line on your screen. It tells you what is driving the action underneath the price. If you rely on volume after price already moves you will miss the strongest opportunities. The best setups happen when price says one thing but volume disagrees. That is when traders are uncertain and serious money is making moves. Volume should not be a routine check. It should be the tool that shows belief. Once you start seeing how volume reflects the mood you stop reacting and start preparing. And that is where real timing comes from.
FAQs
What’s the difference between tick volume and real volume?
Tick volume counts the number of price changes during a period, while real volume measures the actual number of shares or contracts traded. Tick volume is often used in markets where real volume data is not available.
Does RSI use volume?
No, the Relative Strength Index (RSI) is based solely on price movements and does not factor in trading volume. It measures the strength of recent gains versus losses to identify overbought or oversold conditions.
How to find buy and sell volume?
Buy and sell volume can be estimated using indicators like the Volume Profile, On-Balance Volume (OBV), or through Level 2 data. These tools analyze how volume corresponds with price direction to suggest buying or selling pressure.
Can we rely on volume for long term investing?
Yes, volume can support long-term investing by confirming trends, breakouts, or accumulation phases. However, it should be used alongside fundamentals and broader market analysis for more reliable decisions.
Related Articles
Team that worked on the article
Rinat Gismatullin is an entrepreneur and a business expert with 9 years of experience in trading. He focuses on long-term investing, but also uses intraday trading. He is a private consultant on investing in digital assets and personal finance. Rinat holds two degrees in Economy and Linguistics.
Chinmay Soni is a financial analyst with more than 5 years of experience in working with stocks, Forex, derivatives, and other assets. As a founder of a boutique research firm and an active researcher, he covers various industries and fields, providing insights backed by statistical data. He is also an educator in the field of finance and technology.
As an author for Traders Union, he contributes his deep analytical insights on various topics, taking into account various aspects.
Mirjan Hipolito is a journalist and news editor at Traders Union. She is an expert crypto writer with five years of experience in the financial markets. Her specialties are daily market news, price predictions, and Initial Coin Offerings (ICO).
Forex indicators are tools used by traders to analyze market data, often based on technical and/or fundamental factors, to make informed trading decisions.
Index in trading is the measure of the performance of a group of stocks, which can include the assets and securities in it.
Xetra is a German Stock Exchange trading system that the Frankfurt Stock Exchange operates. Deutsche Börse is the parent company of the Frankfurt Stock Exchange.
Day trading involves buying and selling financial assets within the same trading day, with the goal of profiting from short-term price fluctuations, and positions are typically not held overnight.
Forex leverage is a tool enabling traders to control larger positions with a relatively small amount of capital, amplifying potential profits and losses based on the chosen leverage ratio.


-
 Afghanistan
-
 Albania
-
 Algeria
-
 Argentina
-
 Armenia
-
 Australia
-
 Austria
-
 Azerbaijan
-
 Bahamas
-
 Bahrain
-
 Bangladesh
-
 Belgium
-
 Botswana
-
 Brazil
-
 Brunei
-
 Bulgaria
-
 Burma
Burma
-
 Cambodia
-
 Cameroon
-
 Canada
-
 Chile
Chile
-
 China
China
-
 Colombia
-
 Costa Rica
-
 Cote d'Ivoire
-
 Croatia
-
 Cyprus
-
 Czech Republic
-
 Denmark
-
 Dominican Republic
-
 Ecuador
-
 Egypt
Egypt
-
 Estonia
-
 Eswatini
-
 Ethiopia
-
 Finland
-
 France
-
 Georgia
-
 Germany
-
 Ghana
Ghana
-
 Greece
-
 Haiti
Haiti
-
 Hong Kong
-
 Hungary
-
 India
India
-
 Indonesia
-
 Iran, Islamic republic
-
 Iraq
Iraq
-
 Ireland
-
 Israel
-
 Italy
Italy
-
 Jamaica
-
 Japan
Japan
-
 Jordan
-
 Kazakhstan
-
 Kenya
Kenya
-
 Korea
Korea
-
 Kuwait
-
 Kyrgyzstan
-
 Laos
Laos
-
 Latvia
-
 Lebanon
-
 Libyan Arab Jamahiriya
-
 Lithuania
-
 Luxembourg
-
 Macedonia
-
 Madagascar
-
 Malaysia
-
 Malta
Malta
-
 Mauritius
-
 Mexico
-
 Moldova
-
 Mongolia
-
 Montenegro
-
 Morocco
-
 Mozambique
-
 Namibia
-
 Nepal
Nepal
-
 Netherlands
-
 Nigeria
-
 Norway
-
 Oman
Oman
-
 Pakistan
-
 Palestine
-
 Papua New Guinea
-
 Peru
Peru
-
 Philippines
-
 Poland
-
 Portugal
-
 Puerto Rico
-
 Qatar
Qatar
-
 Romania
-
 Rwanda
-
 Saudi Arabia
-
 Serbia
-
 Singapore
-
 Slovakia
-
 Slovenia
-
 Somalia
-
 South Africa
-
 Spain
Spain
-
 Sri Lanka
-
 Sweden
-
 Switzerland
-
 Syrian Arab Republic
-
 Taiwan
-
 Tajikistan
-
 Tanzania, United Republic Of
-
 Thailand
-
 Trinidad and Tobago
-
 Tunisia
-
 Turkey
-
 UAE
UAE
-
 Uganda
-
 Ukraine
-
 United Kingdom
-
United States
-
 Uzbekistan
-
 Venezuela
-
 Vietnam
-
 Yemen
Yemen
-
 Zambia
-
 Zimbabwe
- Forex
- Crypto
