
Qualcomm stock slides 3.27% as sellers hold sway below near-term averages

Qualcomm (QCOM) stock is trading at $199.29, down 3.27% on the day and near the session low. The price sits below its key short- and medium-term moving averages while remaining above long-term trend support levels.
 170.60
178.65
170.60
178.65
Highlights
- Qualcomm acquires Modular for nearly $4 billion, expanding its AI infrastructure presence into enterprise and data centers.
- The company lifts its 2029 non-handset revenue goal to $40 billion and secures major AI hardware partnerships with Meta and Microsoft.
- QCOM trades within $180.32 to $218.26 under strong bearish momentum, with sellers dominating and downside risk elevated.
AI software acquisition and partnerships drive diversification push amid selloff
Qualcomm announced the acquisition of AI infrastructure software company Modular for nearly $4 billion, bringing advanced software capabilities that immediately extend its reach into the enterprise and data center markets, according to Simplywall. The company also raised its long-term non-handset revenue target for fiscal 2029 to $40 billion, underscoring a continued commitment to diversify beyond smartphone chips. Multi-year partnerships were secured with both Meta Platforms and Microsoft for next-generation AI server hardware deployments, as reported by Blockonomi and Coincentral. Qualcomm’s recent expansion of AI data center offerings, including a partnership with Hugging Face, further widens its platform in AI infrastructure—though price action has remained under broader selling pressure.
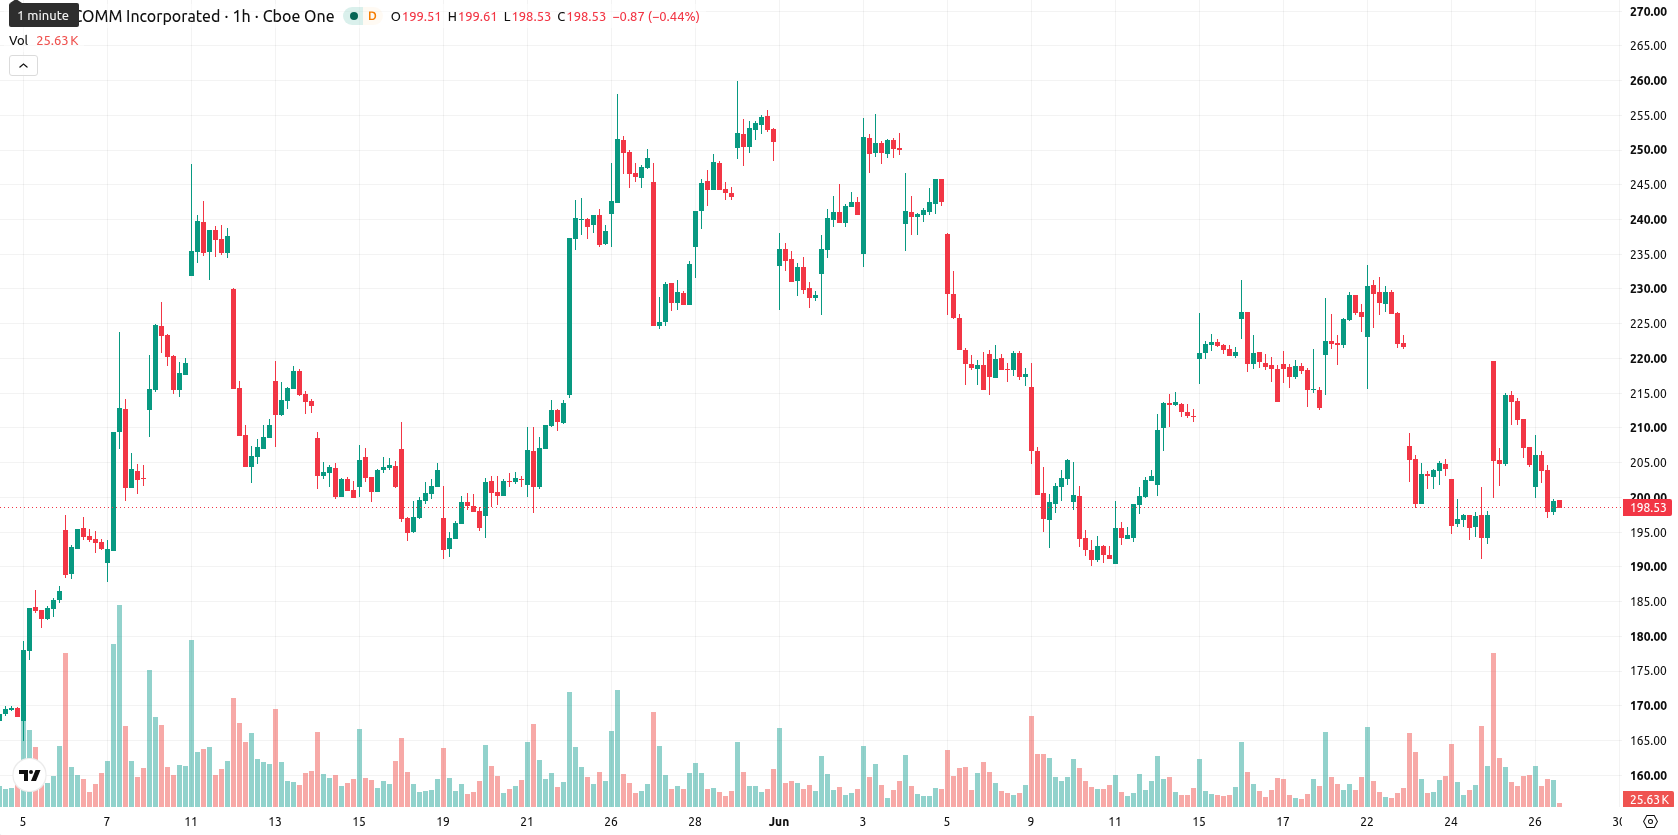
Downtrend persists as technical signals turn broadly bearish
Technically, QCOM trades below the MA-20 and MA-50, with the MA-200 offering support. The Ichimoku Kijun on the daily chart stands at $207.18 and acts as immediate resistance. Relative Strength Index (RSI) is at 44.93, indicating a sell zone but not yet oversold, while the Commodity Channel Index (CCI) and Stochastic RSI are neutral. Momentum signals—including the Moving Average Convergence Divergence (MACD), Average Directional Index (ADX), and Awesome Oscillator—are all bearish, with Bull/Bear Power in oversold territory and volatility remaining high intraday.
Downside risk elevated as volatility and technical barriers persist
Over the short term, QCOM is likely to remain volatile, with the expected trading range projected between $180.32 and $218.26. The probability of further declines remains very high, with upside surprises seen as unlikely given the current technical setup. A breakout above $207.18 could prompt short covering, but a drop below $180.32 would likely accelerate selling momentum. The base case envisions QCOM fluctuating within these levels as the market digests recent developments.
Previously it was reported that despite Qualcomm's strategic push into AI and data center markets, persistent selling pressure led analysts to anticipate a cautious, range-bound outlook. The latest technical weakness and continued volatility reinforce this view, making it critical for investors to monitor the $207.18 resistance and $180.32 support as signals for any shift in the prevailing trend.


Latest Qualcomm News





-
 Afghanistan
-
 Albania
-
 Algeria
-
 Angola
-
 Argentina
-
 Armenia
-
 Australia
-
 Austria
-
 Azerbaijan
-
 Bahamas
-
 Bahrain
-
 Bangladesh
-
 Belarus
-
 Belgium
-
 Bolivia
-
 Botswana
-
 Brazil
-
 Brunei
-
 Bulgaria
-
 Cambodia
-
 Cameroon
-
 Canada
-
 Chile
Chile
-
 China
China
-
 Colombia
-
 Congo
Congo
-
 Costa Rica
-
 Cote d'Ivoire
-
 Croatia
-
 Cuba
Cuba
-
 Cyprus
-
 Czechia
-
 DR Congo
-
 Denmark
-
 Dominican Republic
-
 Ecuador
-
 Egypt
Egypt
-
 El Salvador
-
 Estonia
-
 Eswatini
-
 Ethiopia
-
 Finland
-
 France
-
 Georgia
-
 Germany
-
 Ghana
Ghana
-
 Greece
-
 Haiti
Haiti
-
 Hong Kong
-
 Hungary
-
 India
India
-
 Indonesia
-
 Iran, Islamic republic
-
 Iraq
Iraq
-
 Ireland
-
 Israel
-
 Italy
Italy
-
 Jamaica
-
 Japan
Japan
-
 Jordan
-
 Kazakhstan
-
 Kenya
Kenya
-
 Korea
Korea
-
 Kuwait
-
 Kyrgyzstan
-
 Laos
Laos
-
 Latvia
-
 Lebanon
-
 Lesotho
-
 Libya
Libya
-
 Lithuania
-
 Luxembourg
-
 Madagascar
-
 Malaysia
-
 Malta
Malta
-
 Mauritius
-
 Mexico
-
 Moldova
-
 Mongolia
-
 Montenegro
-
 Morocco
-
 Mozambique
-
 Myanmar
-
 Namibia
-
 Nepal
Nepal
-
 Netherlands
-
 New Zealand
-
 Nigeria
-
 North Macedonia
-
 Norway
-
 Oman
Oman
-
 Pakistan
-
 Palestine
-
 Panama
-
 Papua New Guinea
-
 Paraguay
-
 Peru
Peru
-
 Philippines
-
 Poland
-
 Portugal
-
 Puerto Rico
-
 Qatar
Qatar
-
 Reunion
-
 Romania
-
 Rwanda
-
 Saudi Arabia
-
 Serbia
-
 Singapore
-
 Slovakia
-
 Slovenia
-
 Somalia
-
 South Africa
-
 Spain
Spain
-
 Sri Lanka
-
 Sweden
-
 Switzerland
-
 Syria
Syria
-
 Taiwan
-
 Tajikistan
-
 Tanzania
-
 Thailand
-
 Trinidad and Tobago
-
 Tunisia
-
 Turkey
-
 UAE
UAE
-
 Uganda
-
 Ukraine
-
 United Kingdom
-
United States
-
 Uruguay
-
 Uzbekistan
-
 Venezuela
-
 Vietnam
-
 Yemen
Yemen
-
 Zambia
-
 Zimbabwe
- Forex
- Crypto












