

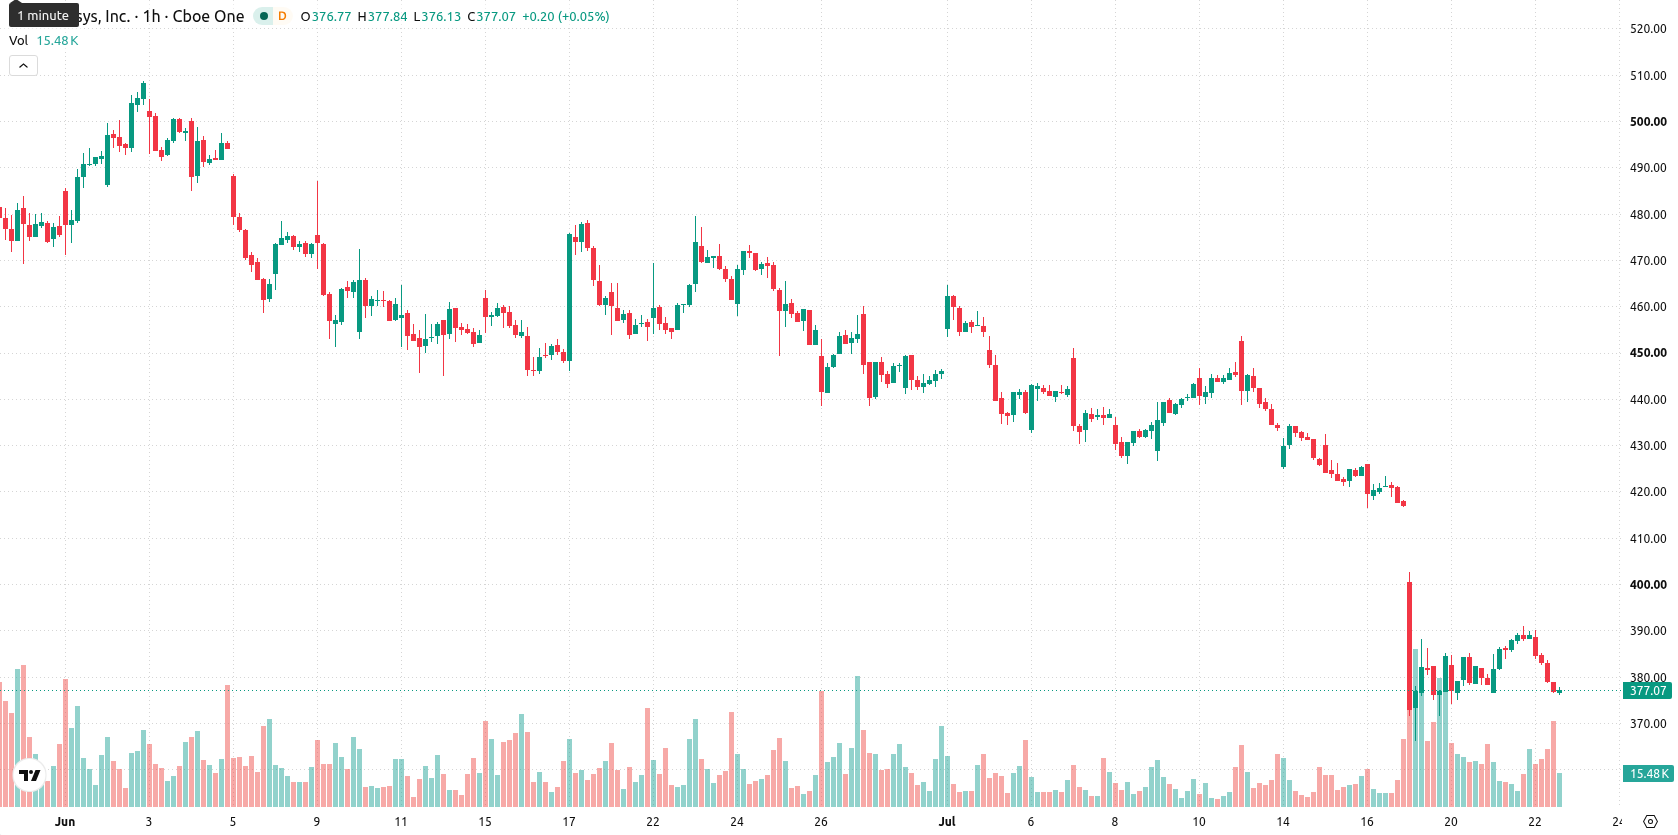
Synopsys (SNPS) stock is trading at $376.34, down 3.24% for the day. The stock remains below its key moving averages, reflecting persistent downward pressure.
 394.29
391.03
394.29
391.03
Highlights
- SNPS trades under key moving averages, reflecting persistent seller control across all trading timeframes.
- Momentum indicators point to a pronounced bearish trend, with oversold signals and no bullish divergence observed.
- Over the next 2–3 days, SNPS is forecast to range between $349.82 and $402.86, with a 77% probability of continued downside.
Technical indicators confirm bearish momentum and sustained oversold pressure
On the hourly chart, SNPS is trading below the MA-20 ($382.66) and MA-50 ($401.48), while also remaining under the MA-200 ($453.1) on the daily timeframe. Immediate resistance is marked by the Ichimoku Kijun level at $378.52. Momentum indicators highlight persistent weakness: MACD signals Strong Sell, ADX indicates a Sell, and RSI is at 34.87 in the Sell zone. Stoch RSI, CCI, and Bull/Bear Power all register oversold readings or seller dominance, and the Awesome Oscillator confirms ongoing bearish momentum. Throughout the session, price action showed no bullish divergence and closed near the day's lows.
Downside risk elevated as stabilization depends on resistance test
Over the next 2 to 3 trading days, SNPS is expected to trade within a volatility band ranging from $349.82 to $402.86. The probability of an upward move is low at 23%, while a downward continuation holds a higher likelihood of 77%. The baseline scenario anticipates stabilization between established support and resistance levels. A move above the Kijun resistance at $378.52 could trigger recovery, while a break below immediate support would likely accelerate losses toward the lower end of the projected range.
Previously it was reported that Synopsys faced sustained bearish pressure with downside risks outweighing the potential for a near-term recovery. The latest price action and momentum data reinforce the negative outlook, making a break below immediate support a key risk for traders to monitor in the coming sessions.


Latest Synopsys News





-
 Afghanistan
-
 Albania
-
 Algeria
-
 Angola
-
 Argentina
-
 Armenia
-
 Australia
-
 Austria
-
 Azerbaijan
-
 Bahamas
-
 Bahrain
-
 Bangladesh
-
 Belarus
-
 Belgium
-
 Bolivia
-
 Botswana
-
 Brazil
-
 Brunei
-
 Bulgaria
-
 Cambodia
-
 Cameroon
-
 Canada
-
 Chile
Chile
-
 China
China
-
 Colombia
-
 Congo
Congo
-
 Costa Rica
-
 Cote d'Ivoire
-
 Croatia
-
 Cuba
Cuba
-
 Cyprus
-
 Czechia
-
 DR Congo
-
 Denmark
-
 Dominican Republic
-
 Ecuador
-
 Egypt
Egypt
-
 El Salvador
-
 Estonia
-
 Eswatini
-
 Ethiopia
-
 Finland
-
 France
-
 Georgia
-
 Germany
-
 Ghana
Ghana
-
 Greece
-
 Haiti
Haiti
-
 Hong Kong
-
 Hungary
-
 India
India
-
 Indonesia
-
 Iran, Islamic republic
-
 Iraq
Iraq
-
 Ireland
-
 Israel
-
 Italy
Italy
-
 Jamaica
-
 Japan
Japan
-
 Jordan
-
 Kazakhstan
-
 Kenya
Kenya
-
 Korea
Korea
-
 Kuwait
-
 Kyrgyzstan
-
 Laos
Laos
-
 Latvia
-
 Lebanon
-
 Lesotho
-
 Libya
Libya
-
 Lithuania
-
 Luxembourg
-
 Madagascar
-
 Malaysia
-
 Malta
Malta
-
 Mauritius
-
 Mexico
-
 Moldova
-
 Mongolia
-
 Montenegro
-
 Morocco
-
 Mozambique
-
 Myanmar
-
 Namibia
-
 Nepal
Nepal
-
 Netherlands
-
 New Zealand
-
 Nigeria
-
 North Macedonia
-
 Norway
-
 Oman
Oman
-
 Pakistan
-
 Palestine
-
 Panama
-
 Papua New Guinea
-
 Paraguay
-
 Peru
Peru
-
 Philippines
-
 Poland
-
 Portugal
-
 Puerto Rico
-
 Qatar
Qatar
-
 Reunion
-
 Romania
-
 Rwanda
-
 Saudi Arabia
-
 Serbia
-
 Singapore
-
 Slovakia
-
 Slovenia
-
 Somalia
-
 South Africa
-
 Spain
Spain
-
 Sri Lanka
-
 Sweden
-
 Switzerland
-
 Syria
Syria
-
 Taiwan
-
 Tajikistan
-
 Tanzania
-
 Thailand
-
 Trinidad and Tobago
-
 Tunisia
-
 Turkey
-
 UAE
UAE
-
 Uganda
-
 Ukraine
-
 United Kingdom
-
United States
-
 Uruguay
-
 Uzbekistan
-
 Venezuela
-
 Vietnam
-
 Yemen
Yemen
-
 Zambia
-
 Zimbabwe
- Forex
- Crypto












