
Celestia: weak momentum and bearish signals led to a 7% price drop

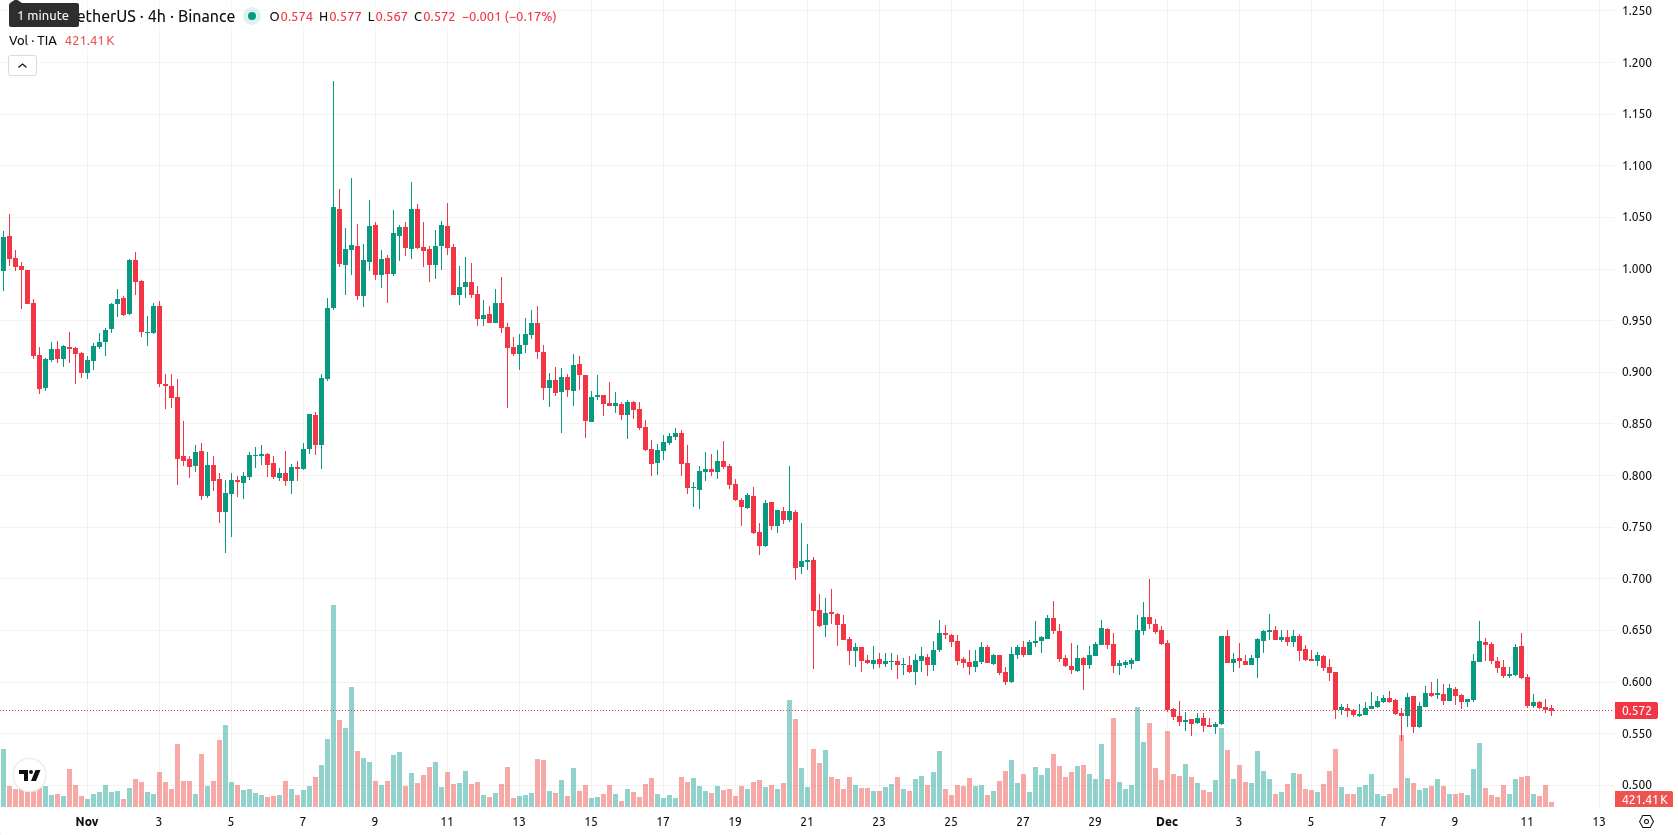
Celestia (TIA) is currently trading at $0.571, which places it below the MA-20 ($0.6171), MA-50 ($0.8000), and MA-200 ($1.4810), indicating persistent bearishness across short-, medium-, and long-term timeframes.
Highlights
- TIA trades at $0.571, remaining below MA-20 ($0.6171), MA-50 ($0.8000), and MA-200 ($1.4810), signaling persistent bearish momentum across all timeframes.
- Negative daily momentum is indicated by D1 MACD and ADX, while high intraday volatility and a 7% price decline underscore continued selling pressure.
- Expected trading range for the next five sessions is $0.515 to $0.635 with less than a 20% probability of a sustained price increase.
Mixed momentum signals as sellers dominate below key resistance
The nearest dynamic support and resistance are identified at the Ichimoku Kijun level ($0.7195, resistance) and MA-5 ($0.5956, support), suggesting sellers remain in control. Momentum signals remain negative, with the D1 MACD and ADX both pointing to selling pressure and a moderate trend strength. The RSI is near the 42 level and the Stoch RSI reads as overbought, while the CCI is neutral, presenting some divergence in overbought/oversold interpretations. BBP mildly favors buyers but shows only marginal dominance. The Awesome Oscillator does not confirm the current downward momentum. The session opened without a significant gap from the previous close, and with the price slipping 7% to $0.571 (near today’s low of $0.573), intraday volatility is high, and the tone has been pressured since the open.
Further downside likely as bearish trend indicators persist
For the next five sessions, the expected trading range is adjusted to $0.515 to $0.635, reflecting typical volatility around the current price. There is a very low probability (less than 20%) of a sustained price increase, while the likelihood of continued downside is much higher, as all major weekly momentum and trend indicators remain bearish. Baseline scenario anticipates the price stabilizing between support and resistance. A bullish scenario requires a breakout above $0.635, while a bearish scenario could trigger if the price falls below $0.515.
Previously it was reported that Celestia was trading just below short-term moving averages, reflecting consolidation amid prevailing bearish pressures across medium- and long-term trends. Momentum indicators remained mixed, with the MACD signaling strong bearishness, ADX confirming a downward trend, and the session opened with a clear upside gap despite the probability of further price rises staying very low over the near term.


Latest Celestia News


-
 Afghanistan
-
 Albania
-
 Algeria
-
 Angola
-
 Argentina
-
 Armenia
-
 Australia
-
 Austria
-
 Azerbaijan
-
 Bahamas
-
 Bahrain
-
 Bangladesh
-
 Belarus
-
 Belgium
-
 Bolivia
-
 Botswana
-
 Brazil
-
 Brunei
-
 Bulgaria
-
 Cambodia
-
 Cameroon
-
 Canada
-
 Chile
Chile
-
 China
China
-
 Colombia
-
 Congo
Congo
-
 Costa Rica
-
 Cote d'Ivoire
-
 Croatia
-
 Cuba
Cuba
-
 Cyprus
-
 Czechia
-
 DR Congo
-
 Denmark
-
 Dominican Republic
-
 Ecuador
-
 Egypt
Egypt
-
 El Salvador
-
 Estonia
-
 Eswatini
-
 Ethiopia
-
 Finland
-
 France
-
 Georgia
-
 Germany
-
 Ghana
Ghana
-
 Greece
-
 Haiti
Haiti
-
 Hong Kong
-
 Hungary
-
 India
India
-
 Indonesia
-
 Iran, Islamic republic
-
 Iraq
Iraq
-
 Ireland
-
 Israel
-
 Italy
Italy
-
 Jamaica
-
 Japan
Japan
-
 Jordan
-
 Kazakhstan
-
 Kenya
Kenya
-
 Korea
Korea
-
 Kuwait
-
 Kyrgyzstan
-
 Laos
Laos
-
 Latvia
-
 Lebanon
-
 Lesotho
-
 Libya
Libya
-
 Lithuania
-
 Luxembourg
-
 Madagascar
-
 Malaysia
-
 Malta
Malta
-
 Mauritius
-
 Mexico
-
 Moldova
-
 Mongolia
-
 Montenegro
-
 Morocco
-
 Mozambique
-
 Myanmar
-
 Namibia
-
 Nepal
Nepal
-
 Netherlands
-
 New Zealand
-
 Nigeria
-
 North Macedonia
-
 Norway
-
 Oman
Oman
-
 Pakistan
-
 Palestine
-
 Panama
-
 Papua New Guinea
-
 Paraguay
-
 Peru
Peru
-
 Philippines
-
 Poland
-
 Portugal
-
 Puerto Rico
-
 Qatar
Qatar
-
 Reunion
-
 Romania
-
 Rwanda
-
 Saudi Arabia
-
 Serbia
-
 Singapore
-
 Slovakia
-
 Slovenia
-
 Somalia
-
 South Africa
-
 Spain
Spain
-
 Sri Lanka
-
 Sweden
-
 Switzerland
-
 Syria
Syria
-
 Taiwan
-
 Tajikistan
-
 Tanzania
-
 Thailand
-
 Trinidad and Tobago
-
 Tunisia
-
 Turkey
-
 UAE
UAE
-
 Uganda
-
 Ukraine
-
 United Kingdom
-
United States
-
 Uruguay
-
 Uzbekistan
-
 Venezuela
-
 Vietnam
-
 Yemen
Yemen
-
 Zambia
-
 Zimbabwe
- Forex
- Crypto
