
The Graph: negative indicators and resistance cap further declines at 7.61%

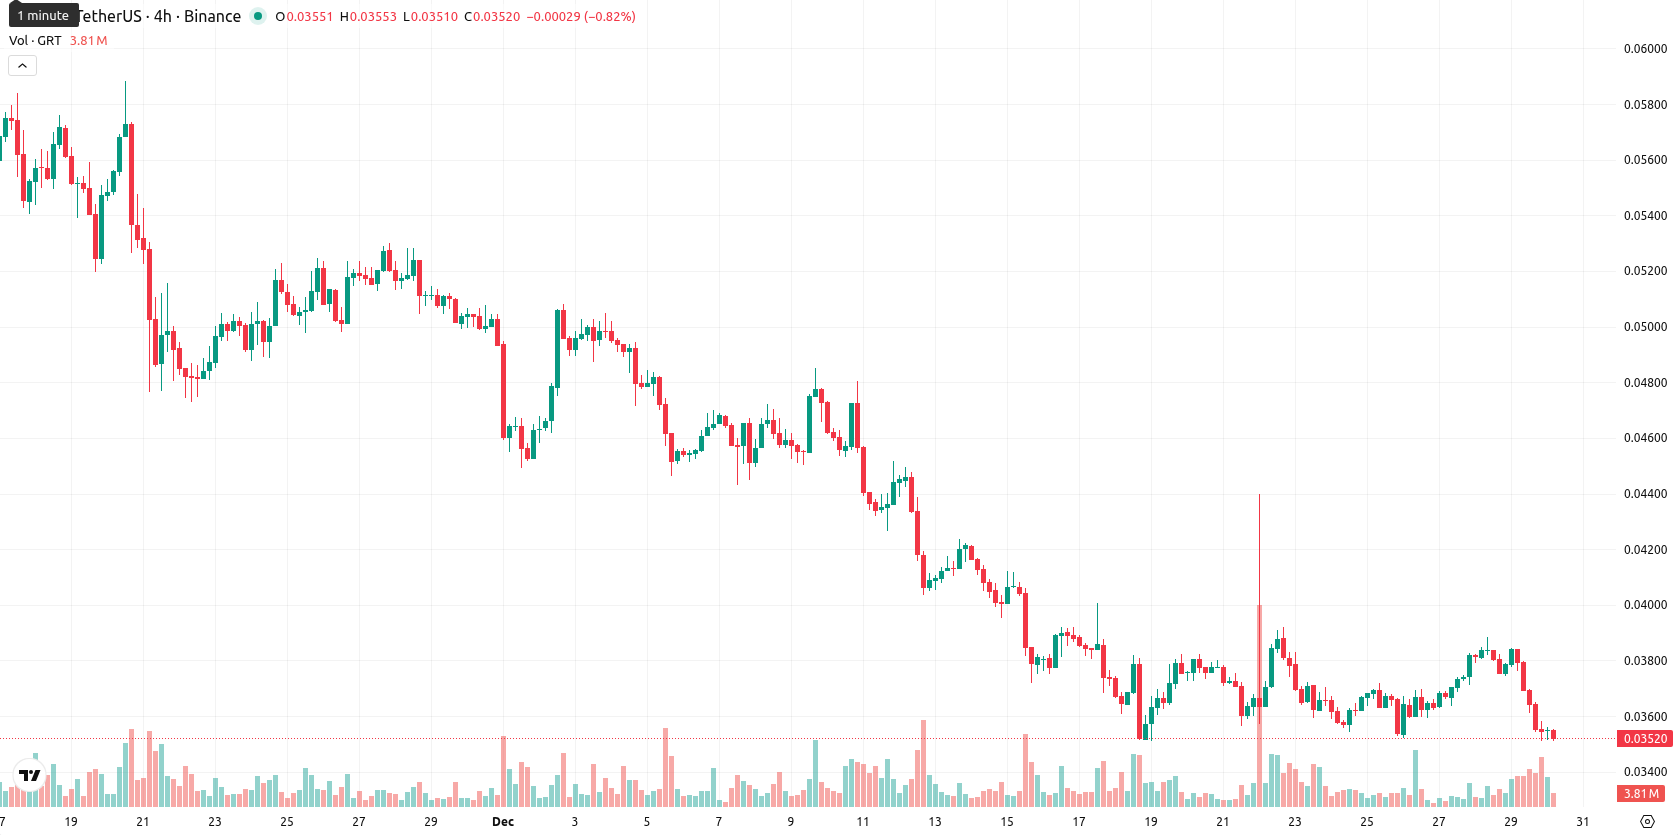
The Graph (GRT) remains below its key moving averages, with the current price of $0.0352 trading under the MA-20 at $0.0385, the MA-50 at $0.0469, and the MA-200 at $0.0760, indicating persistent short-, medium-, and long-term bearish pressure. The nearest dynamic resistance is located at the Ichimoku Kijun level of $0.0427, while the price lacks meaningful support from moving averages in the current technical structure.
Highlights
- The Graph (GRT) price at $0.0352 remains below key moving averages—MA-20 at $0.0385, MA-50 at $0.0469, MA-200 at $0.0760—signaling persistent bearish pressure across all timeframes.
- Momentum and oscillator indicators, including daily MACD, ADX, RSI at 34.95, and Stochastic RSI, collectively confirm strong downside momentum and a defined short-term downtrend for GRT.
- GRT is projected to trade between $0.0315 and $0.0370 over the next five days, with an 80 percent probability of further decline unless price decisively reclaims $0.0427.
Negative momentum intensifies as indicators confirm downside dominance
Momentum indicators reinforce this bearish environment. The daily MACD shows a strong sell signal, and ADX confirms the presence of a defined downtrend, while the RSI at 34.95 and CCI at –74.33 both indicate growing downside momentum, verging on oversold but not yet extreme. Stochastic RSI flags a strong sell, while Bull/Bear Power (BBP) is slightly positive but does not outweigh the dominance of sellers seen in other indicators. The Awesome Oscillator is neutral and does not contradict this setup. GRT opened today with a small gap down (from a previous close of $0.0381 to an open of $0.0354), and the last price of $0.0352 hovers near the session low of $0.03515, reflecting high intraday volatility and persistent pressure after the open. The combination of soft oscillators, negative momentum, and downward price action all reinforce a cautious tone for the session.
High downside risk persists as volatility anchors short-term outlook
Looking ahead, the price is expected to trade within a volatility band relative to current levels between $0.0315 and $0.0370 over the next five trading days. The probability of further decline is very high (more than 80%), while a sustained rebound is less likely. In the baseline scenario, GRT fluctuates in a sideways corridor centered around the $0.034–$0.036 zone. A bullish scenario would require a decisive move above $0.0427, with buyers regaining control and pushing toward stronger resistance, while a clear break below $0.0315 could trigger further selling as the market seeks new support levels; the direction of both daily and weekly momentum suggests that downward pressure will likely persist in the short term.
Last time, analysts noted that The Graph (GRT) is trading well below its major moving averages, with persistent downside momentum and all key indicators (MACD, ADX, RSI, CCI, Stoch RSI) reflecting firmly bearish and oversold conditions. Given sustained sell pressure and high volatility, the asset is expected to remain weak within a $0.034-$0.041 range unless momentum indicators reverse or support levels are breached.


-
 Afghanistan
-
 Albania
-
 Algeria
-
 Angola
-
 Argentina
-
 Armenia
-
 Australia
-
 Austria
-
 Azerbaijan
-
 Bahamas
-
 Bahrain
-
 Bangladesh
-
 Belarus
-
 Belgium
-
 Bolivia
-
 Botswana
-
 Brazil
-
 Brunei
-
 Bulgaria
-
 Cambodia
-
 Cameroon
-
 Canada
-
 Chile
Chile
-
 China
China
-
 Colombia
-
 Congo
Congo
-
 Costa Rica
-
 Cote d'Ivoire
-
 Croatia
-
 Cuba
Cuba
-
 Cyprus
-
 Czechia
-
 DR Congo
-
 Denmark
-
 Dominican Republic
-
 Ecuador
-
 Egypt
Egypt
-
 El Salvador
-
 Estonia
-
 Eswatini
-
 Ethiopia
-
 Finland
-
 France
-
 Georgia
-
 Germany
-
 Ghana
Ghana
-
 Greece
-
 Haiti
Haiti
-
 Hong Kong
-
 Hungary
-
 India
India
-
 Indonesia
-
 Iran, Islamic republic
-
 Iraq
Iraq
-
 Ireland
-
 Israel
-
 Italy
Italy
-
 Jamaica
-
 Japan
Japan
-
 Jordan
-
 Kazakhstan
-
 Kenya
Kenya
-
 Korea
Korea
-
 Kuwait
-
 Kyrgyzstan
-
 Laos
Laos
-
 Latvia
-
 Lebanon
-
 Lesotho
-
 Libya
Libya
-
 Lithuania
-
 Luxembourg
-
 Madagascar
-
 Malaysia
-
 Malta
Malta
-
 Mauritius
-
 Mexico
-
 Moldova
-
 Mongolia
-
 Montenegro
-
 Morocco
-
 Mozambique
-
 Myanmar
-
 Namibia
-
 Nepal
Nepal
-
 Netherlands
-
 New Zealand
-
 Nigeria
-
 North Macedonia
-
 Norway
-
 Oman
Oman
-
 Pakistan
-
 Palestine
-
 Panama
-
 Papua New Guinea
-
 Paraguay
-
 Peru
Peru
-
 Philippines
-
 Poland
-
 Portugal
-
 Puerto Rico
-
 Qatar
Qatar
-
 Reunion
-
 Romania
-
 Rwanda
-
 Saudi Arabia
-
 Serbia
-
 Singapore
-
 Slovakia
-
 Slovenia
-
 Somalia
-
 South Africa
-
 Spain
Spain
-
 Sri Lanka
-
 Sweden
-
 Switzerland
-
 Syria
Syria
-
 Taiwan
-
 Tajikistan
-
 Tanzania
-
 Thailand
-
 Trinidad and Tobago
-
 Tunisia
-
 Turkey
-
 UAE
UAE
-
 Uganda
-
 Ukraine
-
 United Kingdom
-
United States
-
 Uruguay
-
 Uzbekistan
-
 Venezuela
-
 Vietnam
-
 Yemen
Yemen
-
 Zambia
-
 Zimbabwe
- Forex
- Crypto
