
Jito jumps 7.89% as intraday buyers dominate despite overbought warnings

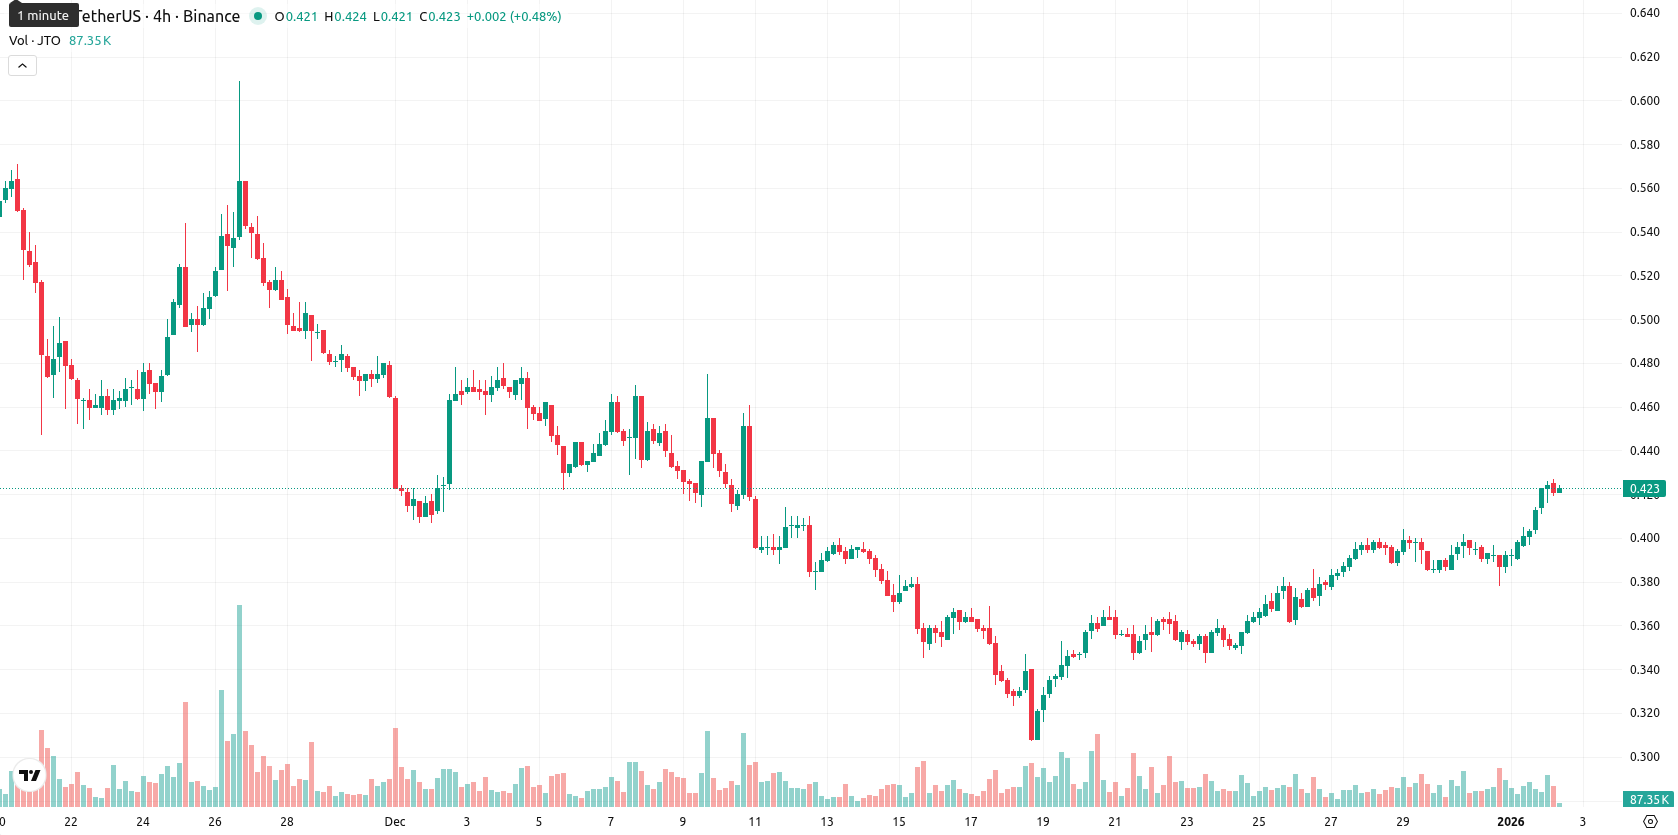
Jito (JTO) is currently trading at $0.424, standing above the MA-20 ($0.3709) but below the MA-50 ($0.4430) and well under the MA-200 ($1.3677). This setup points to positive short-term momentum against ongoing medium- and long-term downward pressure, with dynamic support at the Ichimoku Kijun ($0.3910) and immediate resistance at the MA-50.
 0.6301
0.6550
0.6301
0.6550
Highlights
- JTO trades at $0.424, above the MA-20 ($0.3709) but below the MA-50 ($0.4430) and MA-200 ($1.3677), reflecting short-term strength amid medium- and long-term weakness.
- Daily momentum is mixed: MACD and ADX remain bearish, RSI at 53 signals mild bullishness, and overbought oscillators warn of potential near-term pullback.
- Expected weekly range for JTO is $0.382 to $0.466, with a decline more likely given bearish weekly indicators and low probability of further upside.
Bullish momentum diverges from overbought signals amid volatility
Momentum indicators present a mixed view: the daily MACD signals strong bearishness, while ADX also points to seller control. However, RSI at 53 suggests mild bullishness, and Stoch RSI along with CCI are both firmly in overbought territory, warning of possible exhaustion for buyers. Bull/Bear Power remains positive, signaling buyers dominate intraday momentum, while the Awesome Oscillator is neutral. The price opened above the previous close, trading near today’s high after climbing 7.89%. Intraday volatility is moderate and momentum aligns with the strong upward push after the open, though overbought oscillators highlight the risk of a near-term pullback. There is a clear divergence between strong short-term momentum and overextended oscillator signals.
Consolidation likely as weekly sell pressure curbs upside
For the coming week, JTO is expected to trade between $0.382 and $0.466, reflecting a typical volatility band relative to current levels. The probability of a further price increase remains very low (below 20%), as sell signals dominate across major weekly indicators. The baseline scenario is for JTO to consolidate within this range; a bullish breakout requires a decisive move above the $0.4430 resistance, while a drop below the $0.3910 Kijun support would open the way for deeper retracements.
Previously it was reported that Jito (JTO) is exhibiting mild short-term upward momentum above its 20-day moving average, yet remains constrained by medium- and long-term bearish signals as it trades below the 50- and 200-day averages. Despite strong intraday buying and near-term support around $0.3910, technical indicators including the MACD, ADX, and oscillators highlight prevailing bearish momentum, with resistance near $0.4487 and a continued risk of rangebound consolidation.








-
 Afghanistan
-
 Albania
-
 Algeria
-
 Angola
-
 Argentina
-
 Armenia
-
 Australia
-
 Austria
-
 Azerbaijan
-
 Bahamas
-
 Bahrain
-
 Bangladesh
-
 Belarus
-
 Belgium
-
 Bolivia
-
 Botswana
-
 Brazil
-
 Brunei
-
 Bulgaria
-
 Cambodia
-
 Cameroon
-
 Canada
-
 Chile
Chile
-
 China
China
-
 Colombia
-
 Congo
Congo
-
 Costa Rica
-
 Cote d'Ivoire
-
 Croatia
-
 Cuba
Cuba
-
 Cyprus
-
 Czechia
-
 DR Congo
-
 Denmark
-
 Dominican Republic
-
 Ecuador
-
 Egypt
Egypt
-
 El Salvador
-
 Estonia
-
 Eswatini
-
 Ethiopia
-
 Finland
-
 France
-
 Georgia
-
 Germany
-
 Ghana
Ghana
-
 Greece
-
 Haiti
Haiti
-
 Hong Kong
-
 Hungary
-
 India
India
-
 Indonesia
-
 Iran, Islamic republic
-
 Iraq
Iraq
-
 Ireland
-
 Israel
-
 Italy
Italy
-
 Jamaica
-
 Japan
Japan
-
 Jordan
-
 Kazakhstan
-
 Kenya
Kenya
-
 Korea
Korea
-
 Kuwait
-
 Kyrgyzstan
-
 Laos
Laos
-
 Latvia
-
 Lebanon
-
 Lesotho
-
 Libya
Libya
-
 Lithuania
-
 Luxembourg
-
 Madagascar
-
 Malaysia
-
 Malta
Malta
-
 Mauritius
-
 Mexico
-
 Moldova
-
 Mongolia
-
 Montenegro
-
 Morocco
-
 Mozambique
-
 Myanmar
-
 Namibia
-
 Nepal
Nepal
-
 Netherlands
-
 New Zealand
-
 Nigeria
-
 North Macedonia
-
 Norway
-
 Oman
Oman
-
 Pakistan
-
 Palestine
-
 Panama
-
 Papua New Guinea
-
 Paraguay
-
 Peru
Peru
-
 Philippines
-
 Poland
-
 Portugal
-
 Puerto Rico
-
 Qatar
Qatar
-
 Reunion
-
 Romania
-
 Rwanda
-
 Saudi Arabia
-
 Serbia
-
 Singapore
-
 Slovakia
-
 Slovenia
-
 Somalia
-
 South Africa
-
 Spain
Spain
-
 Sri Lanka
-
 Sweden
-
 Switzerland
-
 Syria
Syria
-
 Taiwan
-
 Tajikistan
-
 Tanzania
-
 Thailand
-
 Trinidad and Tobago
-
 Tunisia
-
 Turkey
-
 UAE
UAE
-
 Uganda
-
 Ukraine
-
 United Kingdom
-
United States
-
 Uruguay
-
 Uzbekistan
-
 Venezuela
-
 Vietnam
-
 Yemen
Yemen
-
 Zambia
-
 Zimbabwe
- Forex
- Crypto












