
+7.23% for The Graph — rally meets mixed momentum and overbought signals

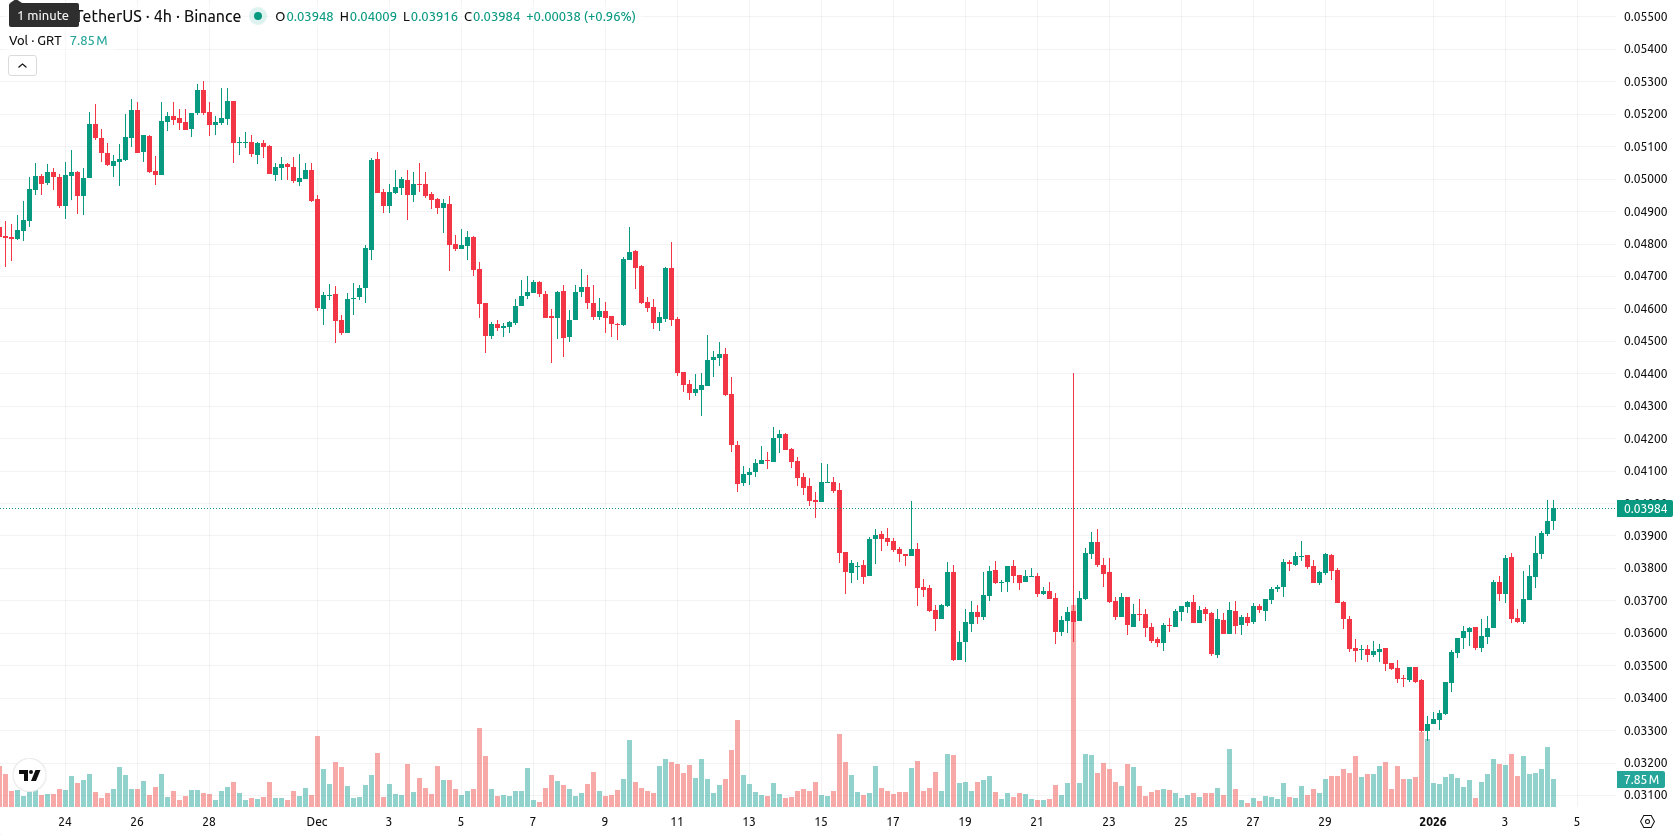
The Graph (GRT) is trading at $0.039183, posting a daily gain of 7.23%. The asset remains above its MA-20 ($0.036825), but is still facing resistance from its MA-50 ($0.044217) and MA-200 ($0.074765), highlighting a short-term bullish bias amid broader ongoing selling pressure.
Highlights
- GRT trades at $0.039183, above its MA-20 ($0.036825) but below its MA-50 ($0.044217) and MA-200 ($0.074765), indicating a short-term bullish bias amid medium- and long-term resistance.
- Daily gains reach 7.23% with high intraday volatility and strength near session highs, yet indicators like MACD and ADX remain bearish, suggesting momentum may be limited.
- For the coming week, the projected range is $0.0370 to $0.0420, with a less than 20% probability of a sustained rebound and sideways consolidation as the baseline scenario.
Overbought rally tests resistance as momentum signals diverge
Nearest dynamic support is located near the Ichimoku Kijun at $0.040575, with the MA-50 forming immediate resistance for further upside attempts. Momentum signals are mixed: both daily MACD and ADX remain bearish, suggesting upward momentum is limited, while the Stoch RSI points to overbought conditions and CCI trends positive. Bull/Bear Power (BBP) reflects buyer dominance for the day, although the divergence between classic momentum and price oscillators signals a lack of clear directional conviction. The current price action opened with a bullish gap and is hovering near session highs, but the rally could be overheated according to oscillators.
Sideways consolidation likely as rebound odds remain low
Looking ahead to the coming week, a typical volatility band is expected between $0.0370 and $0.0420, representing a likely ±5–7% move from current levels. Persistent 'Sell' signals from weekly momentum and key moving averages suggest that a sustained rebound is unlikely, with less than a 20% chance of an upward breakout. The primary scenario calls for GRT to consolidate sideways within this narrow range; a move above $0.0442 (MA-50) would be required to restart a bullish trend, while a drop below $0.0370 may accelerate further selling.
Previously it was reported that The Graph remains under key moving averages despite a recent intraday gain, with technical indicators including MACD, ADX, and RSI maintaining a bearish outlook and highlighting persistent seller control. Resistance is situated at the Ichimoku Kijun level, while short-term support is just below current prices, suggesting limited upside potential as downside bias persists.


-
 Afghanistan
-
 Albania
-
 Algeria
-
 Angola
-
 Argentina
-
 Armenia
-
 Australia
-
 Austria
-
 Azerbaijan
-
 Bahamas
-
 Bahrain
-
 Bangladesh
-
 Belarus
-
 Belgium
-
 Bolivia
-
 Botswana
-
 Brazil
-
 Brunei
-
 Bulgaria
-
 Cambodia
-
 Cameroon
-
 Canada
-
 Chile
Chile
-
 China
China
-
 Colombia
-
 Congo
Congo
-
 Costa Rica
-
 Cote d'Ivoire
-
 Croatia
-
 Cuba
Cuba
-
 Cyprus
-
 Czechia
-
 DR Congo
-
 Denmark
-
 Dominican Republic
-
 Ecuador
-
 Egypt
Egypt
-
 El Salvador
-
 Estonia
-
 Eswatini
-
 Ethiopia
-
 Finland
-
 France
-
 Georgia
-
 Germany
-
 Ghana
Ghana
-
 Greece
-
 Haiti
Haiti
-
 Hong Kong
-
 Hungary
-
 India
India
-
 Indonesia
-
 Iran, Islamic republic
-
 Iraq
Iraq
-
 Ireland
-
 Israel
-
 Italy
Italy
-
 Jamaica
-
 Japan
Japan
-
 Jordan
-
 Kazakhstan
-
 Kenya
Kenya
-
 Korea
Korea
-
 Kuwait
-
 Kyrgyzstan
-
 Laos
Laos
-
 Latvia
-
 Lebanon
-
 Lesotho
-
 Libya
Libya
-
 Lithuania
-
 Luxembourg
-
 Madagascar
-
 Malaysia
-
 Malta
Malta
-
 Mauritius
-
 Mexico
-
 Moldova
-
 Mongolia
-
 Montenegro
-
 Morocco
-
 Mozambique
-
 Myanmar
-
 Namibia
-
 Nepal
Nepal
-
 Netherlands
-
 New Zealand
-
 Nigeria
-
 North Macedonia
-
 Norway
-
 Oman
Oman
-
 Pakistan
-
 Palestine
-
 Panama
-
 Papua New Guinea
-
 Paraguay
-
 Peru
Peru
-
 Philippines
-
 Poland
-
 Portugal
-
 Puerto Rico
-
 Qatar
Qatar
-
 Reunion
-
 Romania
-
 Rwanda
-
 Saudi Arabia
-
 Serbia
-
 Singapore
-
 Slovakia
-
 Slovenia
-
 Somalia
-
 South Africa
-
 Spain
Spain
-
 Sri Lanka
-
 Sweden
-
 Switzerland
-
 Syria
Syria
-
 Taiwan
-
 Tajikistan
-
 Tanzania
-
 Thailand
-
 Trinidad and Tobago
-
 Tunisia
-
 Turkey
-
 UAE
UAE
-
 Uganda
-
 Ukraine
-
 United Kingdom
-
United States
-
 Uruguay
-
 Uzbekistan
-
 Venezuela
-
 Vietnam
-
 Yemen
Yemen
-
 Zambia
-
 Zimbabwe
- Forex
- Crypto
