
Pendle price prediction: Will overbought signals halt the rally? PENDLE gains 8.85%

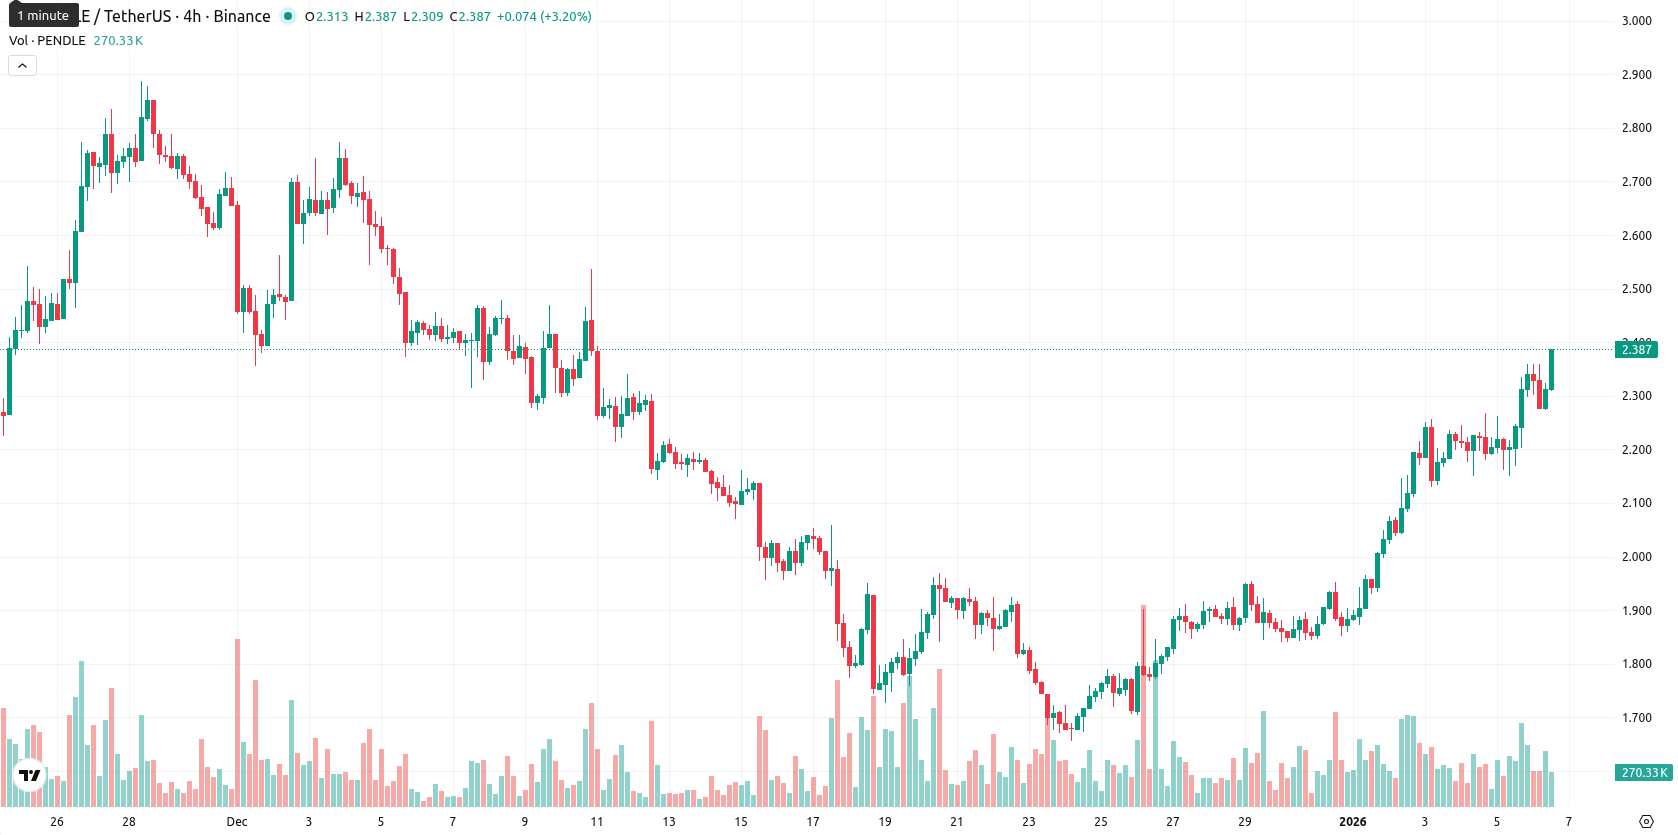
Pendle (PENDLE) is trading at $2.373, up 8.85% for the day. The price has broken above the MA-20 ($1.9199) and MA-50 ($2.2086), but continues to trade well below the MA-200 ($3.6775), signaling short- and medium-term bullish momentum with lingering long-term resistance.
Highlights
- PENDLE surged 8.85% intraday to $2.373, closing near the session high and remaining above MA-20 ($1.9199) and MA-50 ($2.2086), but well below MA-200 ($3.6775).
- Momentum indicators show short-term bullishness with ADX at 29.29 and RSI at 63.27, yet Stoch RSI (100) and CCI (197.85) warn of overbought conditions and possible exhaustion.
- For the next five trading days, PENDLE is likely to consolidate between $2.14–$2.49, with further upside probability below 20% and pivotal support at $2.00–$2.02.
Bullish momentum persists despite overbought signals and volatility spike
Momentum indicators present a mixed but bullish intraday profile. The ADX at 29.29 points to strong trend strength, while the MACD on the daily chart is neutral and weekly momentum is softening. The RSI is bullish at 63.27 — yet Stoch RSI and CCI are both in overbought territory (100 and 197.85), suggesting the rally may need a pause. Bull/Bear Power remains positive, and the Awesome Oscillator confirms upward momentum. Today, Pendle gapped up from $2.18 to $2.34, closing near the day's peak ($2.273 – $2.36) with heightened volatility and strong intraday buying pressure. While short-term momentum remains robust, some oscillators warn of overbought risk.
Pullback risk prevails as consolidation expected near technical levels
Over the next five trading days, Pendle's expected range extends from $2.14 to $2.49, reflecting typical volatility relative to current levels. There is a low probability (less than 20%) of further near-term upside, making a pullback or sideways movement more likely. The baseline scenario calls for consolidation between support at $2.14 – $2.20 and resistance at $2.40 – $2.49. A breakout above $2.49 targets the $2.60 level, while a drop below $2.14 could prompt a test of the $2.00 – $2.02 Kijun support zone.
Last time, analysts noted that Pendle exhibited strong short-term momentum, trading above its 20-day moving average and just over the 50-day average, but was encountering medium- and long-term resistance, with price action holding above dynamic support at $2.10. Momentum signals remained mixed amid overbought oscillators and weakening trend strength, suggesting limited upside within a consolidation range and a heightened risk of short-term pullback.


-
 Afghanistan
-
 Albania
-
 Algeria
-
 Angola
-
 Argentina
-
 Armenia
-
 Australia
-
 Austria
-
 Azerbaijan
-
 Bahamas
-
 Bahrain
-
 Bangladesh
-
 Belarus
-
 Belgium
-
 Bolivia
-
 Botswana
-
 Brazil
-
 Brunei
-
 Bulgaria
-
 Cambodia
-
 Cameroon
-
 Canada
-
 Chile
Chile
-
 China
China
-
 Colombia
-
 Congo
Congo
-
 Costa Rica
-
 Cote d'Ivoire
-
 Croatia
-
 Cuba
Cuba
-
 Cyprus
-
 Czechia
-
 DR Congo
-
 Denmark
-
 Dominican Republic
-
 Ecuador
-
 Egypt
Egypt
-
 El Salvador
-
 Estonia
-
 Eswatini
-
 Ethiopia
-
 Finland
-
 France
-
 Georgia
-
 Germany
-
 Ghana
Ghana
-
 Greece
-
 Haiti
Haiti
-
 Hong Kong
-
 Hungary
-
 India
India
-
 Indonesia
-
 Iran, Islamic republic
-
 Iraq
Iraq
-
 Ireland
-
 Israel
-
 Italy
Italy
-
 Jamaica
-
 Japan
Japan
-
 Jordan
-
 Kazakhstan
-
 Kenya
Kenya
-
 Korea
Korea
-
 Kuwait
-
 Kyrgyzstan
-
 Laos
Laos
-
 Latvia
-
 Lebanon
-
 Lesotho
-
 Libya
Libya
-
 Lithuania
-
 Luxembourg
-
 Madagascar
-
 Malaysia
-
 Malta
Malta
-
 Mauritius
-
 Mexico
-
 Moldova
-
 Mongolia
-
 Montenegro
-
 Morocco
-
 Mozambique
-
 Myanmar
-
 Namibia
-
 Nepal
Nepal
-
 Netherlands
-
 New Zealand
-
 Nigeria
-
 North Macedonia
-
 Norway
-
 Oman
Oman
-
 Pakistan
-
 Palestine
-
 Panama
-
 Papua New Guinea
-
 Paraguay
-
 Peru
Peru
-
 Philippines
-
 Poland
-
 Portugal
-
 Puerto Rico
-
 Qatar
Qatar
-
 Reunion
-
 Romania
-
 Rwanda
-
 Saudi Arabia
-
 Serbia
-
 Singapore
-
 Slovakia
-
 Slovenia
-
 Somalia
-
 South Africa
-
 Spain
Spain
-
 Sri Lanka
-
 Sweden
-
 Switzerland
-
 Syria
Syria
-
 Taiwan
-
 Tajikistan
-
 Tanzania
-
 Thailand
-
 Trinidad and Tobago
-
 Tunisia
-
 Turkey
-
 UAE
UAE
-
 Uganda
-
 Ukraine
-
 United Kingdom
-
United States
-
 Uruguay
-
 Uzbekistan
-
 Venezuela
-
 Vietnam
-
 Yemen
Yemen
-
 Zambia
-
 Zimbabwe
- Forex
- Crypto
