
-7.62% for Pudgy Penguins — overbought momentum signals spark profit-taking

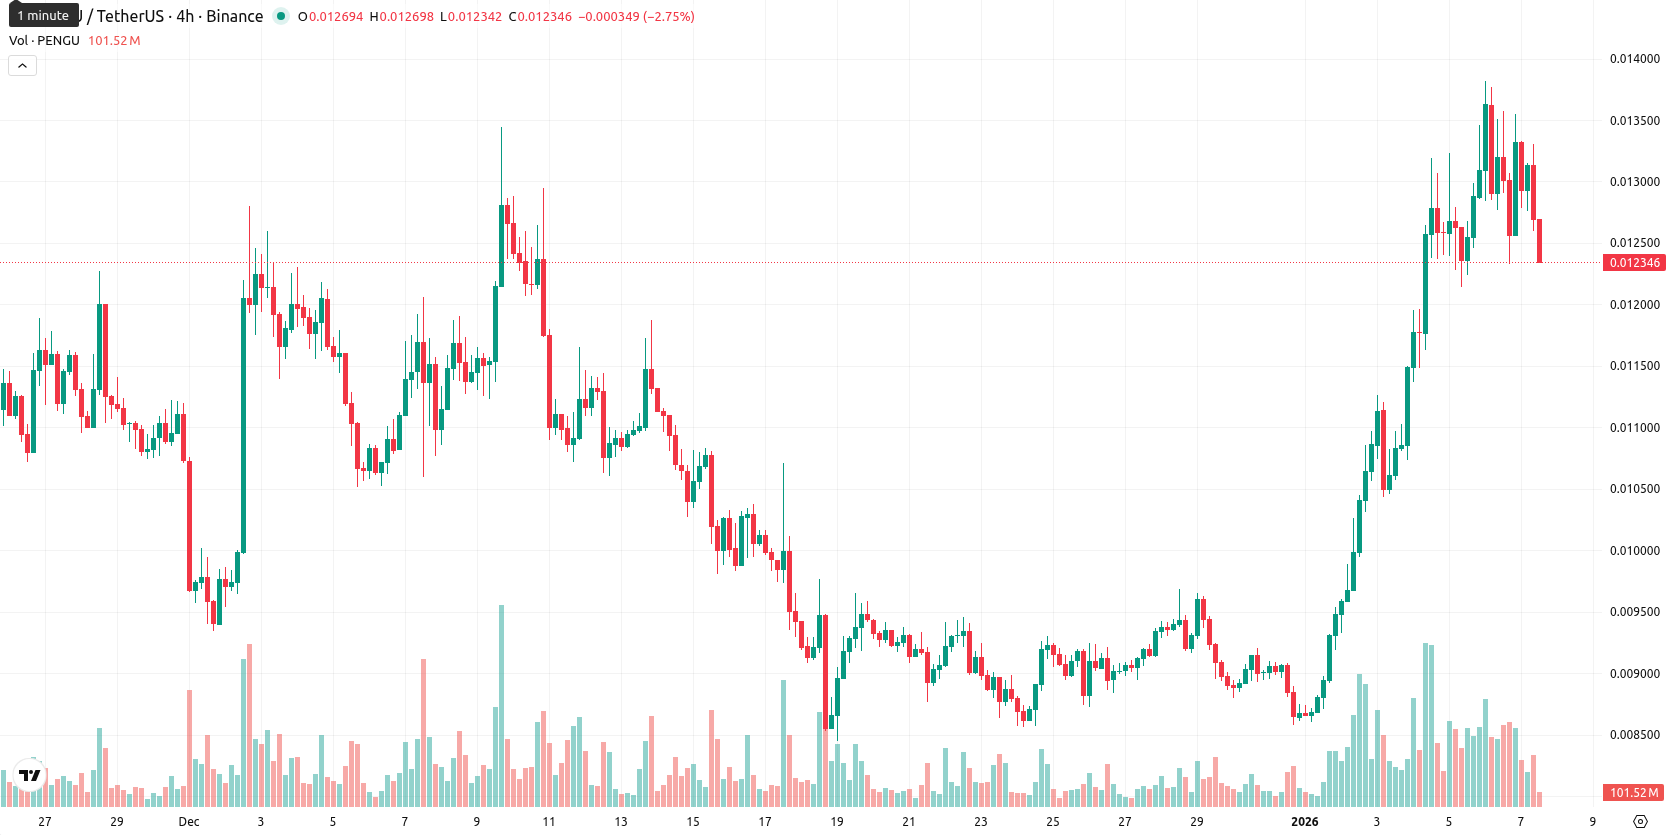
Pudgy Penguins (PENGU) is trading at $0.01239, showing a daily decline of 7.62%. The price is currently above the MA-20 ($0.00988) and MA-50 ($0.01062), but remains well below the MA-200 ($0.02270), highlighting a short- and medium-term bullish structure with notable longer-term resistance.
Highlights
- The current price of $0.01239 is above the MA-20 and MA-50 but remains well below the MA-200 at $0.02270, indicating near-term bullishness yet longer-term overhead resistance.
- Daily price action shows a 7.62% decline from the previous session, with the closing price near the session low and pressure on short-term momentum indicators.
- Despite mixed signals, the probability of a significant price increase next week is estimated below 20%, with a likely range of $0.01150 to $0.01380 and further downside likely if $0.01150 breaks.
Overbought signals emerge as technical supports and mixed momentum persist
The nearest dynamic support for PENGU is aligned with the Ichimoku Kijun at $0.01113. With the price above this level, the MA-50 at $0.01062 acts as the next strongest support, and resistance is seen near $0.01300 – $0.01333. Momentum signals are mixed: the MACD on the daily chart remains neutral, ADX above 25 shows trend strength, and both RSI (near 70) and CCI (above 200) are signaling heavily overbought conditions. The Stochastic RSI is also heavily overbought on the daily chart, while lower intraday timeframes show either oversold or neutral resets. Bull/Bear Power is mildly positive on the daily timeframe, but negative intraday readings suggest sellers are active on rebounds.
Further downside risk as consolidation and technical weakness dominate
Over the next five trading days, PENGU is expected to fluctuate within a typical volatility band between $0.01150 and $0.01380, reflecting recent price action and current levels. With weekly technical indicators (RSI, ADX, MACD) giving Sell signals, the probability of a significant price increase is estimated at less than 20%, so further decline remains more likely in the short term. The base expectation is a consolidation phase as recent gains are digested. A move above $0.01380 would signal renewed buyer momentum and could set up a test of $0.01400, while a drop below $0.01150 would open the way for further declines, with support expected near the Ichimoku Kijun at $0.01113.
Previously it was reported that Pudgy Penguins is maintaining a bullish short- and medium-term structure, trading above its 20- and 50-day moving averages but still constrained by longer-term bearish pressure from the 200-day moving average. However, while momentum indicators like ADX and the Awesome Oscillator remain strong, multiple overbought signals such as elevated RSI and CCI suggest upside is likely limited, with price action expected to consolidate between nearby support and resistance levels unless a clear breakout occurs.


-
 Afghanistan
-
 Albania
-
 Algeria
-
 Angola
-
 Argentina
-
 Armenia
-
 Australia
-
 Austria
-
 Azerbaijan
-
 Bahamas
-
 Bahrain
-
 Bangladesh
-
 Belarus
-
 Belgium
-
 Bolivia
-
 Botswana
-
 Brazil
-
 Brunei
-
 Bulgaria
-
 Cambodia
-
 Cameroon
-
 Canada
-
 Chile
Chile
-
 China
China
-
 Colombia
-
 Congo
Congo
-
 Costa Rica
-
 Cote d'Ivoire
-
 Croatia
-
 Cuba
Cuba
-
 Cyprus
-
 Czechia
-
 DR Congo
-
 Denmark
-
 Dominican Republic
-
 Ecuador
-
 Egypt
Egypt
-
 El Salvador
-
 Estonia
-
 Eswatini
-
 Ethiopia
-
 Finland
-
 France
-
 Georgia
-
 Germany
-
 Ghana
Ghana
-
 Greece
-
 Haiti
Haiti
-
 Hong Kong
-
 Hungary
-
 India
India
-
 Indonesia
-
 Iran, Islamic republic
-
 Iraq
Iraq
-
 Ireland
-
 Israel
-
 Italy
Italy
-
 Jamaica
-
 Japan
Japan
-
 Jordan
-
 Kazakhstan
-
 Kenya
Kenya
-
 Korea
Korea
-
 Kuwait
-
 Kyrgyzstan
-
 Laos
Laos
-
 Latvia
-
 Lebanon
-
 Lesotho
-
 Libya
Libya
-
 Lithuania
-
 Luxembourg
-
 Madagascar
-
 Malaysia
-
 Malta
Malta
-
 Mauritius
-
 Mexico
-
 Moldova
-
 Mongolia
-
 Montenegro
-
 Morocco
-
 Mozambique
-
 Myanmar
-
 Namibia
-
 Nepal
Nepal
-
 Netherlands
-
 New Zealand
-
 Nigeria
-
 North Macedonia
-
 Norway
-
 Oman
Oman
-
 Pakistan
-
 Palestine
-
 Panama
-
 Papua New Guinea
-
 Paraguay
-
 Peru
Peru
-
 Philippines
-
 Poland
-
 Portugal
-
 Puerto Rico
-
 Qatar
Qatar
-
 Reunion
-
 Romania
-
 Rwanda
-
 Saudi Arabia
-
 Serbia
-
 Singapore
-
 Slovakia
-
 Slovenia
-
 Somalia
-
 South Africa
-
 Spain
Spain
-
 Sri Lanka
-
 Sweden
-
 Switzerland
-
 Syria
Syria
-
 Taiwan
-
 Tajikistan
-
 Tanzania
-
 Thailand
-
 Trinidad and Tobago
-
 Tunisia
-
 Turkey
-
 UAE
UAE
-
 Uganda
-
 Ukraine
-
 United Kingdom
-
United States
-
 Uruguay
-
 Uzbekistan
-
 Venezuela
-
 Vietnam
-
 Yemen
Yemen
-
 Zambia
-
 Zimbabwe
- Forex
- Crypto
