
Pudgy Penguins price prediction: Is upside running out? PENGU gains 8.27%

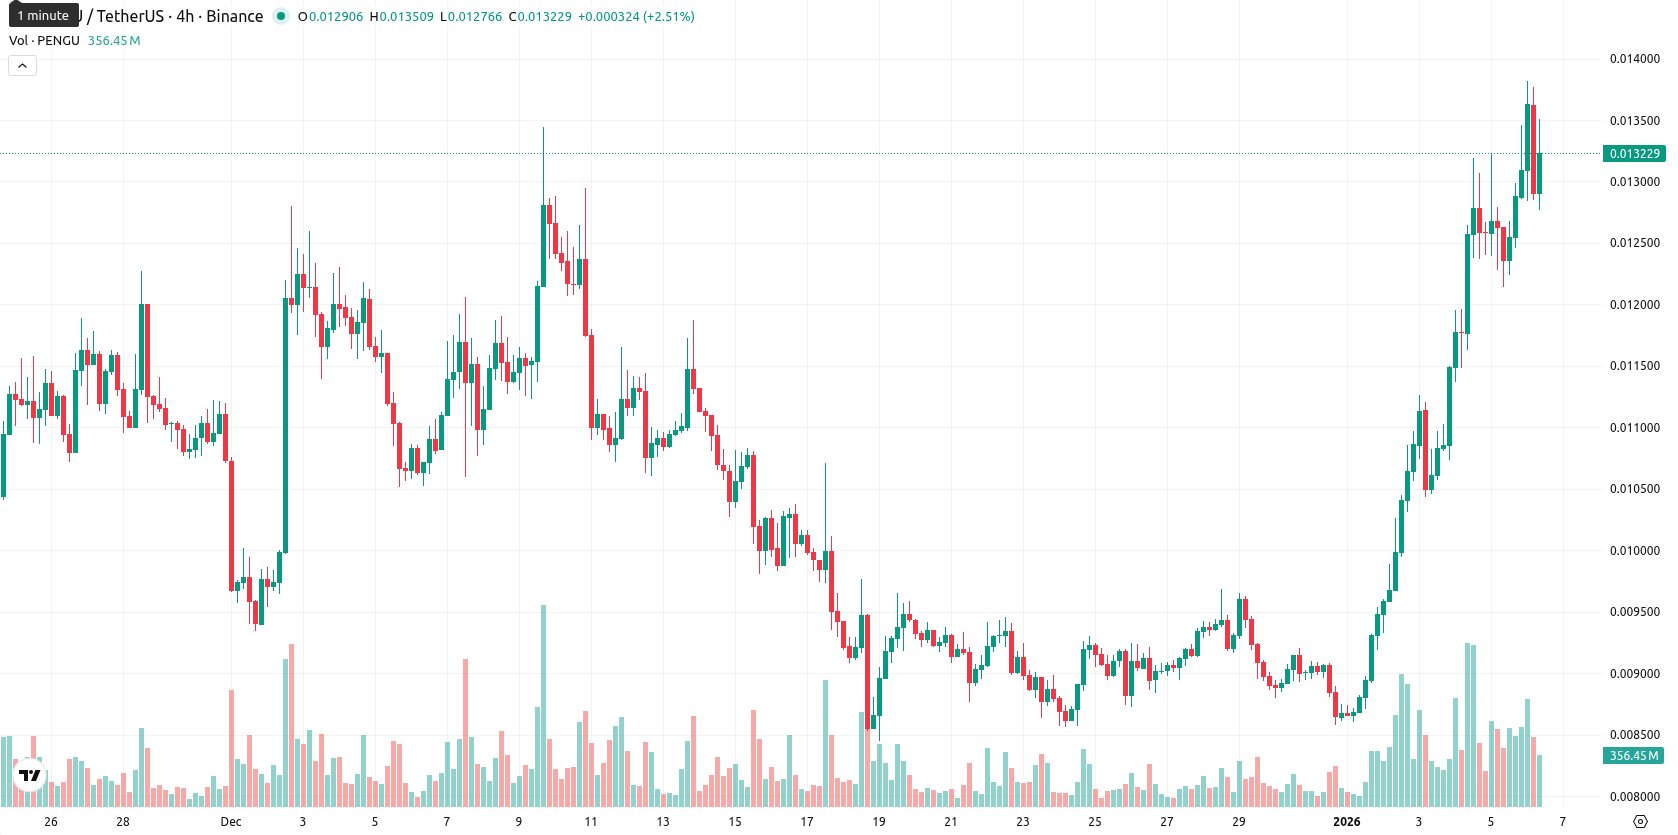
Pudgy Penguins (PENGU) is currently trading at $0.01336, firmly above its MA-20 ($0.00968) and MA-50 ($0.01059) but still well below the MA-200 ($0.02268). This configuration indicates a clear short-term and medium-term bullish structure, while the longer-term trend remains under bearish pressure.
Highlights
- PENGU trades at $0.01336, above its MA-20 ($0.00968) and MA-50 ($0.01059), but remains below the MA-200 ($0.02268), indicating short-term bullish momentum within a longer-term bearish trend.
- Momentum indicators including ADX and Awesome Oscillator support buyer dominance, but RSI at 68.6, CCI at 258.7, and fully overbought Stoch RSI warn of short-term overheating.
- A price corridor of $0.01280–$0.01390 is likely over the next five trading days, with less than 20% probability of a sustained breakout higher and increased likelihood of sideways or downward movement.
Momentum divergence as overbought signals challenge sustained buying
The nearest dynamic support is the Ichimoku Kijun at $0.01095, while the MA-50 at $0.01059 now serves as key support and the next resistance may form near the recent high of $0.01382. Momentum indicators on the daily timeframe show mixed signals. The ADX is trending higher and supports bullish momentum, while the MACD offers a neutral forecast. RSI at 68.6 and CCI at 258.7 are both approaching or at overbought levels, with Stoch RSI fully overbought, indicating short-term overheating. The BBP reading remains positive, reflecting buyer dominance in intraday action. The Awesome Oscillator’s "strong buy" stance adds confirmation to the recent upward movement. There was a slight gap up between yesterday's close and today’s open, and the price is now trading near the higher end of today’s range on high intraday volatility, suggesting continued upward strength and buyer pressure from the open. However, there is a clear divergence between sustained buying momentum and multiple overbought signals, which could limit further short-term upside.
Limited upside as trend signals reinforce volatility-driven consolidation
Looking to the next 5 trading days, the typical volatility band for PENGU is $0.01280 – $0.01390, based on the current price and typical volatility. The probability of a further price increase is very low (less than 20%), making a downward move more likely given the lack of weekly bullish signals from major trend indicators. Baseline scenario: the price oscillates sideways between $0.01280 and $0.01390 as stretched momentum consolidates. Bullish scenario: a move above $0.01390 could trigger trend-following buyers and open a test toward new highs. Bearish scenario: a break below $0.01280 would confirm short-term overextension and could invite more profit-taking, targeting support zones near Kijun.
Previously it was reported that Pudgy Penguins is exhibiting a near-term bullish trend above its short- and medium-term moving averages, with elevated RSI and robust ADX signaling strong, yet potentially overextended, buying momentum. Despite this, upside is limited by longer-term moving average resistance and overbought indicators, suggesting likely range-bound price action or mild retracement unless a decisive breakout above key resistance is achieved.


Latest PENGU News


-
 Afghanistan
-
 Albania
-
 Algeria
-
 Angola
-
 Argentina
-
 Armenia
-
 Australia
-
 Austria
-
 Azerbaijan
-
 Bahamas
-
 Bahrain
-
 Bangladesh
-
 Belarus
-
 Belgium
-
 Bolivia
-
 Botswana
-
 Brazil
-
 Brunei
-
 Bulgaria
-
 Cambodia
-
 Cameroon
-
 Canada
-
 Chile
Chile
-
 China
China
-
 Colombia
-
 Congo
Congo
-
 Costa Rica
-
 Cote d'Ivoire
-
 Croatia
-
 Cuba
Cuba
-
 Cyprus
-
 Czechia
-
 DR Congo
-
 Denmark
-
 Dominican Republic
-
 Ecuador
-
 Egypt
Egypt
-
 El Salvador
-
 Estonia
-
 Eswatini
-
 Ethiopia
-
 Finland
-
 France
-
 Georgia
-
 Germany
-
 Ghana
Ghana
-
 Greece
-
 Haiti
Haiti
-
 Hong Kong
-
 Hungary
-
 India
India
-
 Indonesia
-
 Iran, Islamic republic
-
 Iraq
Iraq
-
 Ireland
-
 Israel
-
 Italy
Italy
-
 Jamaica
-
 Japan
Japan
-
 Jordan
-
 Kazakhstan
-
 Kenya
Kenya
-
 Korea
Korea
-
 Kuwait
-
 Kyrgyzstan
-
 Laos
Laos
-
 Latvia
-
 Lebanon
-
 Lesotho
-
 Libya
Libya
-
 Lithuania
-
 Luxembourg
-
 Madagascar
-
 Malaysia
-
 Malta
Malta
-
 Mauritius
-
 Mexico
-
 Moldova
-
 Mongolia
-
 Montenegro
-
 Morocco
-
 Mozambique
-
 Myanmar
-
 Namibia
-
 Nepal
Nepal
-
 Netherlands
-
 New Zealand
-
 Nigeria
-
 North Macedonia
-
 Norway
-
 Oman
Oman
-
 Pakistan
-
 Palestine
-
 Panama
-
 Papua New Guinea
-
 Paraguay
-
 Peru
Peru
-
 Philippines
-
 Poland
-
 Portugal
-
 Puerto Rico
-
 Qatar
Qatar
-
 Reunion
-
 Romania
-
 Rwanda
-
 Saudi Arabia
-
 Serbia
-
 Singapore
-
 Slovakia
-
 Slovenia
-
 Somalia
-
 South Africa
-
 Spain
Spain
-
 Sri Lanka
-
 Sweden
-
 Switzerland
-
 Syria
Syria
-
 Taiwan
-
 Tajikistan
-
 Tanzania
-
 Thailand
-
 Trinidad and Tobago
-
 Tunisia
-
 Turkey
-
 UAE
UAE
-
 Uganda
-
 Ukraine
-
 United Kingdom
-
United States
-
 Uruguay
-
 Uzbekistan
-
 Venezuela
-
 Vietnam
-
 Yemen
Yemen
-
 Zambia
-
 Zimbabwe
- Forex
- Crypto
