
Pendle price prediction: Bearish bias strengthens as PENDLE retreats below key level

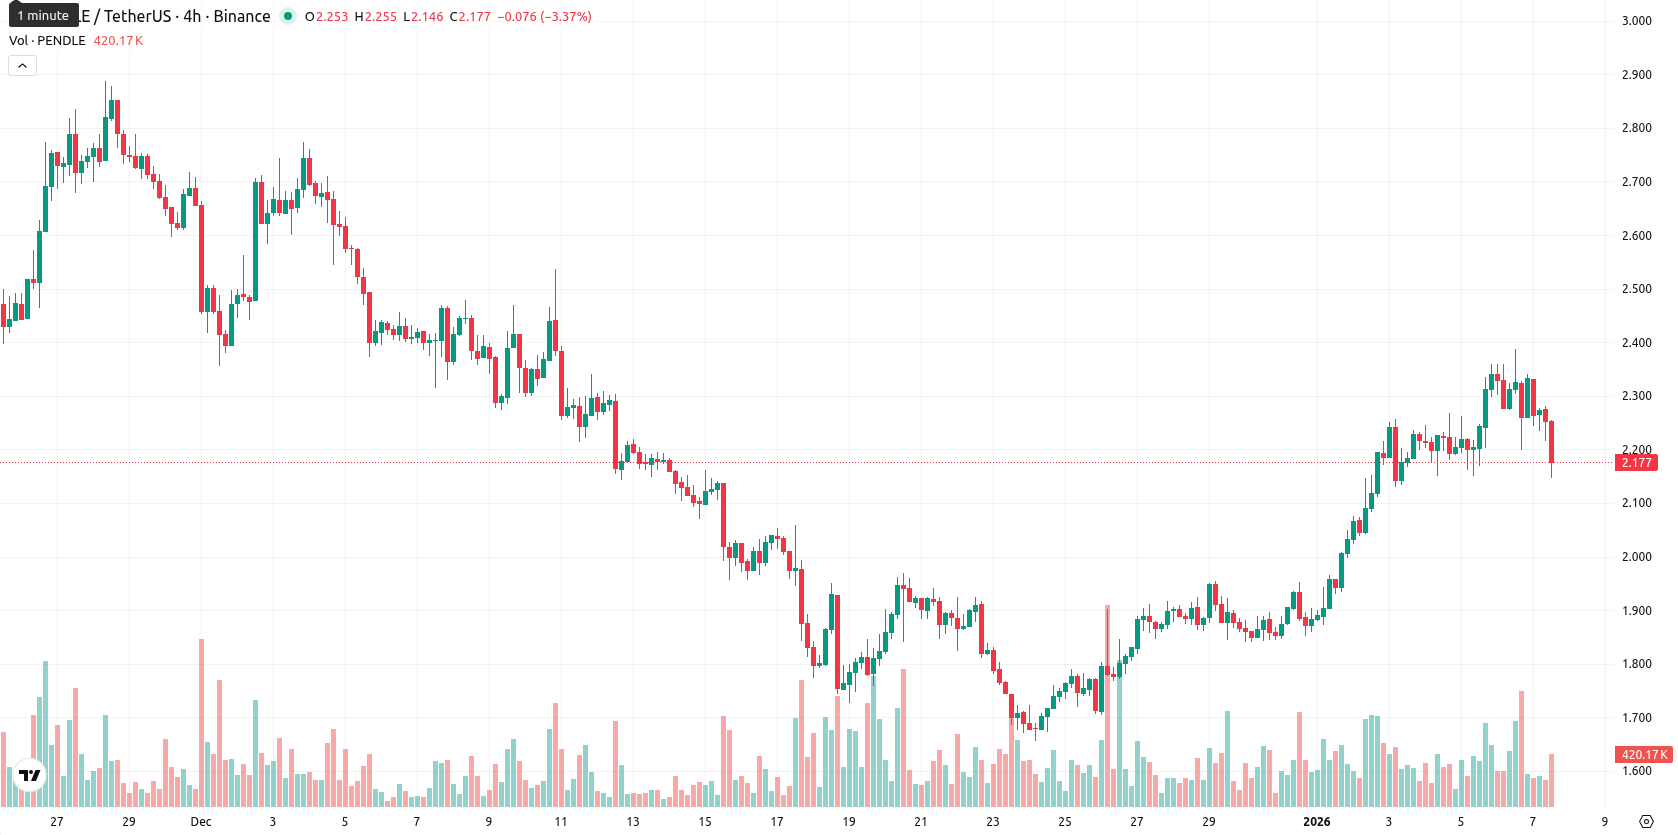
Pendle (PENDLE) is trading at $2.166, positioned above its MA-20 ($1.9450) and just below the MA-50 ($2.2098), while remaining well under the MA-200 ($3.6709). This configuration suggests short-term bullish momentum, medium-term resistance close to the MA-50, and ongoing long-term downward pressure.
Highlights
- PENDLE trades at $2.166, above the MA-20 ($1.9450) but slightly below the MA-50 ($2.2098), indicating short-term bullish momentum with immediate resistance overhead.
- An intraday drop of 8.45% pushed PENDLE near today's low, with high volatility and pronounced selling pressure overriding earlier bullish signals from momentum indicators.
- Technical analysis projects a $1.95–$2.20 trading range for the next five days, with less than 20% probability of a price increase and higher likelihood of consolidation or further decline.
Buyer momentum prevails amid overbought signals and profit-taking
Momentum indicators for PENDLE present a mixed outlook: ADX shows a strengthening trend, but MACD remains neutral. The RSI and CCI both indicate overbought conditions, with the Stochastic RSI also in overbought territory, while Bull/Bear Power continues to reflect buyer dominance. The Awesome Oscillator aligns with a neutral stance. Ichimoku Kijun serves as dynamic support at $2.0210, with resistance set by the MA-50 ($2.2098). The price opened near the last close but has approached today's low after an intraday drop of 8.45%, revealing elevated volatility and ongoing profit-taking.
Bearish bias increases as consolidation looms without breakout
Given recent volatility, the typical price band for PENDLE in the next five trading sessions is expected between $1.95 and $2.20. The probability of a price increase is low (under 20%), and further declines are more likely based on prevailing weekly technical signals. PENDLE is likely to consolidate sideways within this volatility band unless a breakout above the MA-50 ($2.21) or a decisive breakdown below the Ichimoku Kijun ($2.02) shifts the outlook significantly.
Previously it was reported that Pendle is trading above its 20- and 50-day moving averages with strong short-term bullish momentum, though it remains below the 200-day average, indicating ongoing long-term resistance. Momentum and volatility remain elevated, but overbought indicators and mixed trend signals suggest the probability of consolidation or a near-term pullback is higher than a further sustained rally, with expected trading between key support at $2.14–$2.20 and resistance at $2.40–$2.49.


-
 Afghanistan
-
 Albania
-
 Algeria
-
 Angola
-
 Argentina
-
 Armenia
-
 Australia
-
 Austria
-
 Azerbaijan
-
 Bahamas
-
 Bahrain
-
 Bangladesh
-
 Belarus
-
 Belgium
-
 Bolivia
-
 Botswana
-
 Brazil
-
 Brunei
-
 Bulgaria
-
 Cambodia
-
 Cameroon
-
 Canada
-
 Chile
Chile
-
 China
China
-
 Colombia
-
 Congo
Congo
-
 Costa Rica
-
 Cote d'Ivoire
-
 Croatia
-
 Cuba
Cuba
-
 Cyprus
-
 Czechia
-
 DR Congo
-
 Denmark
-
 Dominican Republic
-
 Ecuador
-
 Egypt
Egypt
-
 El Salvador
-
 Estonia
-
 Eswatini
-
 Ethiopia
-
 Finland
-
 France
-
 Georgia
-
 Germany
-
 Ghana
Ghana
-
 Greece
-
 Haiti
Haiti
-
 Hong Kong
-
 Hungary
-
 India
India
-
 Indonesia
-
 Iran, Islamic republic
-
 Iraq
Iraq
-
 Ireland
-
 Israel
-
 Italy
Italy
-
 Jamaica
-
 Japan
Japan
-
 Jordan
-
 Kazakhstan
-
 Kenya
Kenya
-
 Korea
Korea
-
 Kuwait
-
 Kyrgyzstan
-
 Laos
Laos
-
 Latvia
-
 Lebanon
-
 Lesotho
-
 Libya
Libya
-
 Lithuania
-
 Luxembourg
-
 Madagascar
-
 Malaysia
-
 Malta
Malta
-
 Mauritius
-
 Mexico
-
 Moldova
-
 Mongolia
-
 Montenegro
-
 Morocco
-
 Mozambique
-
 Myanmar
-
 Namibia
-
 Nepal
Nepal
-
 Netherlands
-
 New Zealand
-
 Nigeria
-
 North Macedonia
-
 Norway
-
 Oman
Oman
-
 Pakistan
-
 Palestine
-
 Panama
-
 Papua New Guinea
-
 Paraguay
-
 Peru
Peru
-
 Philippines
-
 Poland
-
 Portugal
-
 Puerto Rico
-
 Qatar
Qatar
-
 Reunion
-
 Romania
-
 Rwanda
-
 Saudi Arabia
-
 Serbia
-
 Singapore
-
 Slovakia
-
 Slovenia
-
 Somalia
-
 South Africa
-
 Spain
Spain
-
 Sri Lanka
-
 Sweden
-
 Switzerland
-
 Syria
Syria
-
 Taiwan
-
 Tajikistan
-
 Tanzania
-
 Thailand
-
 Trinidad and Tobago
-
 Tunisia
-
 Turkey
-
 UAE
UAE
-
 Uganda
-
 Ukraine
-
 United Kingdom
-
United States
-
 Uruguay
-
 Uzbekistan
-
 Venezuela
-
 Vietnam
-
 Yemen
Yemen
-
 Zambia
-
 Zimbabwe
- Forex
- Crypto
