
Litecoin price prediction: Bulls test $82 ceiling as LTC gains 1.28%

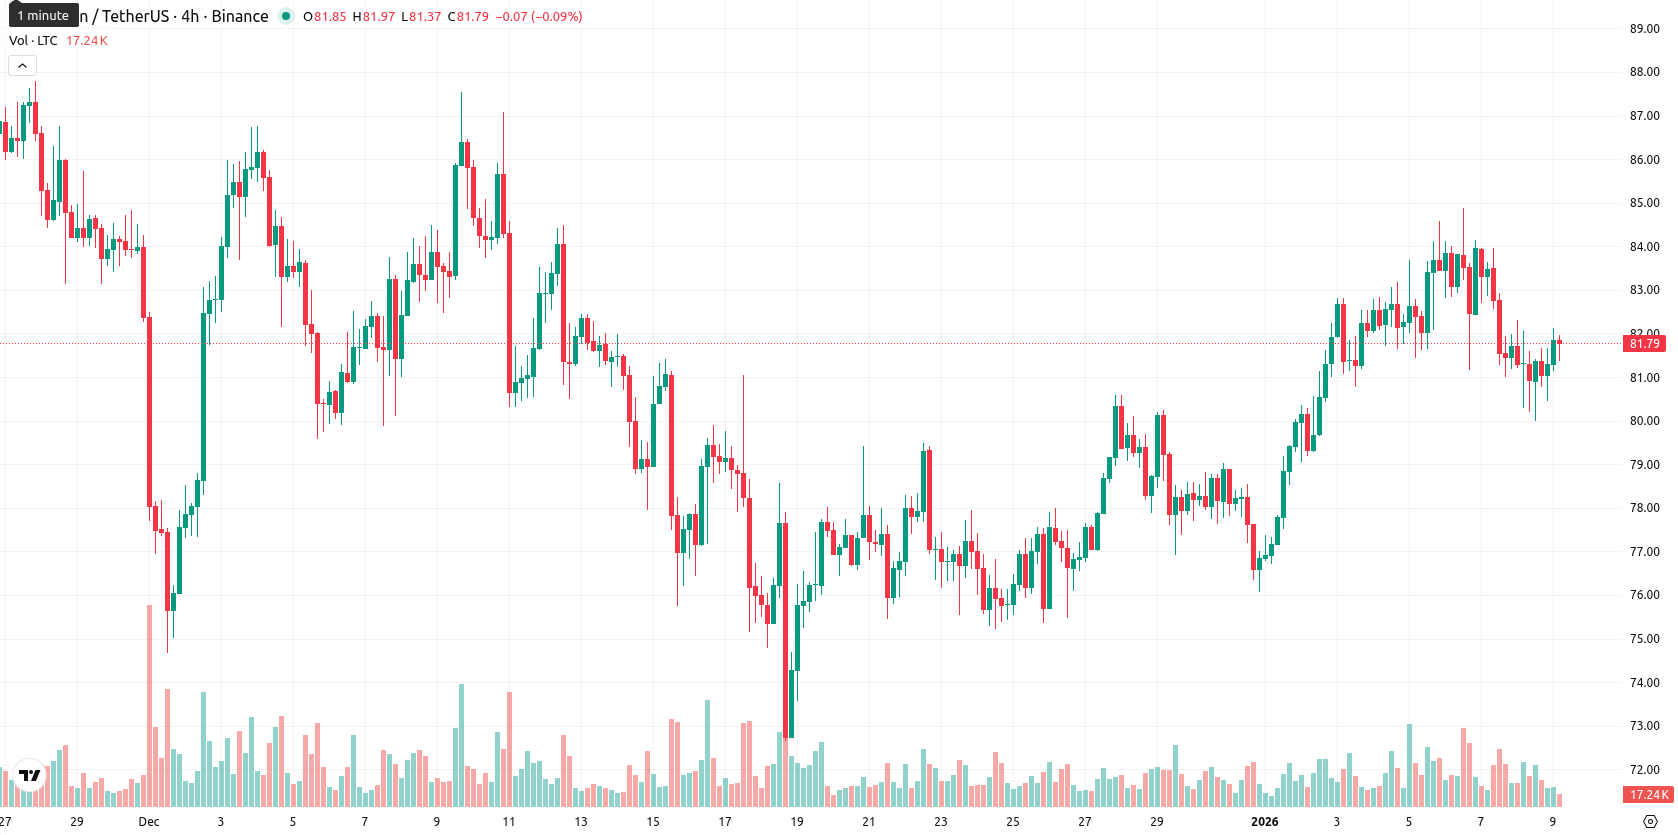
Litecoin (LTC) is trading at $81.76, placing it above the MA-20 ($79.35) and slightly above the MA-50 ($81.08), but well below the MA-200 ($99.31). This setup signals short-term and medium-term upward momentum, but long-term trend pressure from sellers remains.
 48.15
47.90
48.15
47.90
Highlights
- Litecoin trades at $81.76, above the MA-20 ($79.35) and MA-50 ($81.08), but below the MA-200 ($99.31), reflecting mixed trend signals.
- Short-term momentum is mildly bullish with a 1.28% daily price increase, yet momentum indicators such as MACD and ADX remain weak or neutral.
- The five-day expected range is $79.50 to $84.50, with sideways consolidation likely and less than 20% probability of a sustained breakout above $82.
Buyer dominance at range highs as oscillators show caution
The nearest dynamic support for LTC is the Ichimoku Kijun at $78.77, while the MA-50 around $81.08 acts as immediate support and resistance lies near the psychological round level of $82. Momentum is mixed: the MACD is neutral while the ADX is low, suggesting modest trend strength. The RSI and CCI remain in a mild buy zone with no clear overbought or oversold signals, while the Stochastic RSI is neutral and Bull/Bear Power signals an overbought condition, indicating recent buyer dominance but potential for near-term saturation. Bullish pressure is evident as the current price trades near today’s range high (between $81.17 and $82.05), reflecting moderate intraday volatility and strength toward the highs — however, there is a noticeable divergence between upward price action and mixed momentum oscillators, highlighting caution near resistance.
Downside risk prevails as weak trends favor seller control
For the next five trading days, the expected price range is $79.50 to $84.50, which reflects the typical volatility band relative to current levels. There is a very low probability (less than 20%) of a price increase, making a price decline more likely based on weak weekly trend signals from RSI, ADX, MACD, and Moving Averages. The baseline scenario is sideways consolidation around $81–$82. If bulls break above $82, the next resistance target is $84.50, while a bearish move below $79.50 would expose further downside risk, confirming sellers retain control of the longer-term trend.
Previously it was reported that Litecoin is trading above its short- and medium-term moving averages, indicating mild bullish momentum, but remains under long-term bearish pressure. Technical indicators signal mixed momentum and overbought conditions, with immediate resistance near $81.30 and support at $78.77, suggesting consolidation above $80.00 and a greater likelihood of downside in the short term.









-
 Afghanistan
-
 Albania
-
 Algeria
-
 Angola
-
 Argentina
-
 Armenia
-
 Australia
-
 Austria
-
 Azerbaijan
-
 Bahamas
-
 Bahrain
-
 Bangladesh
-
 Belarus
-
 Belgium
-
 Bolivia
-
 Botswana
-
 Brazil
-
 Brunei
-
 Bulgaria
-
 Cambodia
-
 Cameroon
-
 Canada
-
 Chile
Chile
-
 China
China
-
 Colombia
-
 Congo
Congo
-
 Costa Rica
-
 Cote d'Ivoire
-
 Croatia
-
 Cuba
Cuba
-
 Cyprus
-
 Czechia
-
 DR Congo
-
 Denmark
-
 Dominican Republic
-
 Ecuador
-
 Egypt
Egypt
-
 El Salvador
-
 Estonia
-
 Eswatini
-
 Ethiopia
-
 Finland
-
 France
-
 Georgia
-
 Germany
-
 Ghana
Ghana
-
 Greece
-
 Haiti
Haiti
-
 Hong Kong
-
 Hungary
-
 India
India
-
 Indonesia
-
 Iran, Islamic republic
-
 Iraq
Iraq
-
 Ireland
-
 Israel
-
 Italy
Italy
-
 Jamaica
-
 Japan
Japan
-
 Jordan
-
 Kazakhstan
-
 Kenya
Kenya
-
 Korea
Korea
-
 Kuwait
-
 Kyrgyzstan
-
 Laos
Laos
-
 Latvia
-
 Lebanon
-
 Lesotho
-
 Libya
Libya
-
 Lithuania
-
 Luxembourg
-
 Madagascar
-
 Malaysia
-
 Malta
Malta
-
 Mauritius
-
 Mexico
-
 Moldova
-
 Mongolia
-
 Montenegro
-
 Morocco
-
 Mozambique
-
 Myanmar
-
 Namibia
-
 Nepal
Nepal
-
 Netherlands
-
 New Zealand
-
 Nigeria
-
 North Macedonia
-
 Norway
-
 Oman
Oman
-
 Pakistan
-
 Palestine
-
 Panama
-
 Papua New Guinea
-
 Paraguay
-
 Peru
Peru
-
 Philippines
-
 Poland
-
 Portugal
-
 Puerto Rico
-
 Qatar
Qatar
-
 Reunion
-
 Romania
-
 Rwanda
-
 Saudi Arabia
-
 Serbia
-
 Singapore
-
 Slovakia
-
 Slovenia
-
 Somalia
-
 South Africa
-
 Spain
Spain
-
 Sri Lanka
-
 Sweden
-
 Switzerland
-
 Syria
Syria
-
 Taiwan
-
 Tajikistan
-
 Tanzania
-
 Thailand
-
 Trinidad and Tobago
-
 Tunisia
-
 Turkey
-
 UAE
UAE
-
 Uganda
-
 Ukraine
-
 United Kingdom
-
United States
-
 Uruguay
-
 Uzbekistan
-
 Venezuela
-
 Vietnam
-
 Yemen
Yemen
-
 Zambia
-
 Zimbabwe
- Forex
- Crypto












