
XLM weekly report: momentum weakens — MACD sell signal as price hits weekly lows

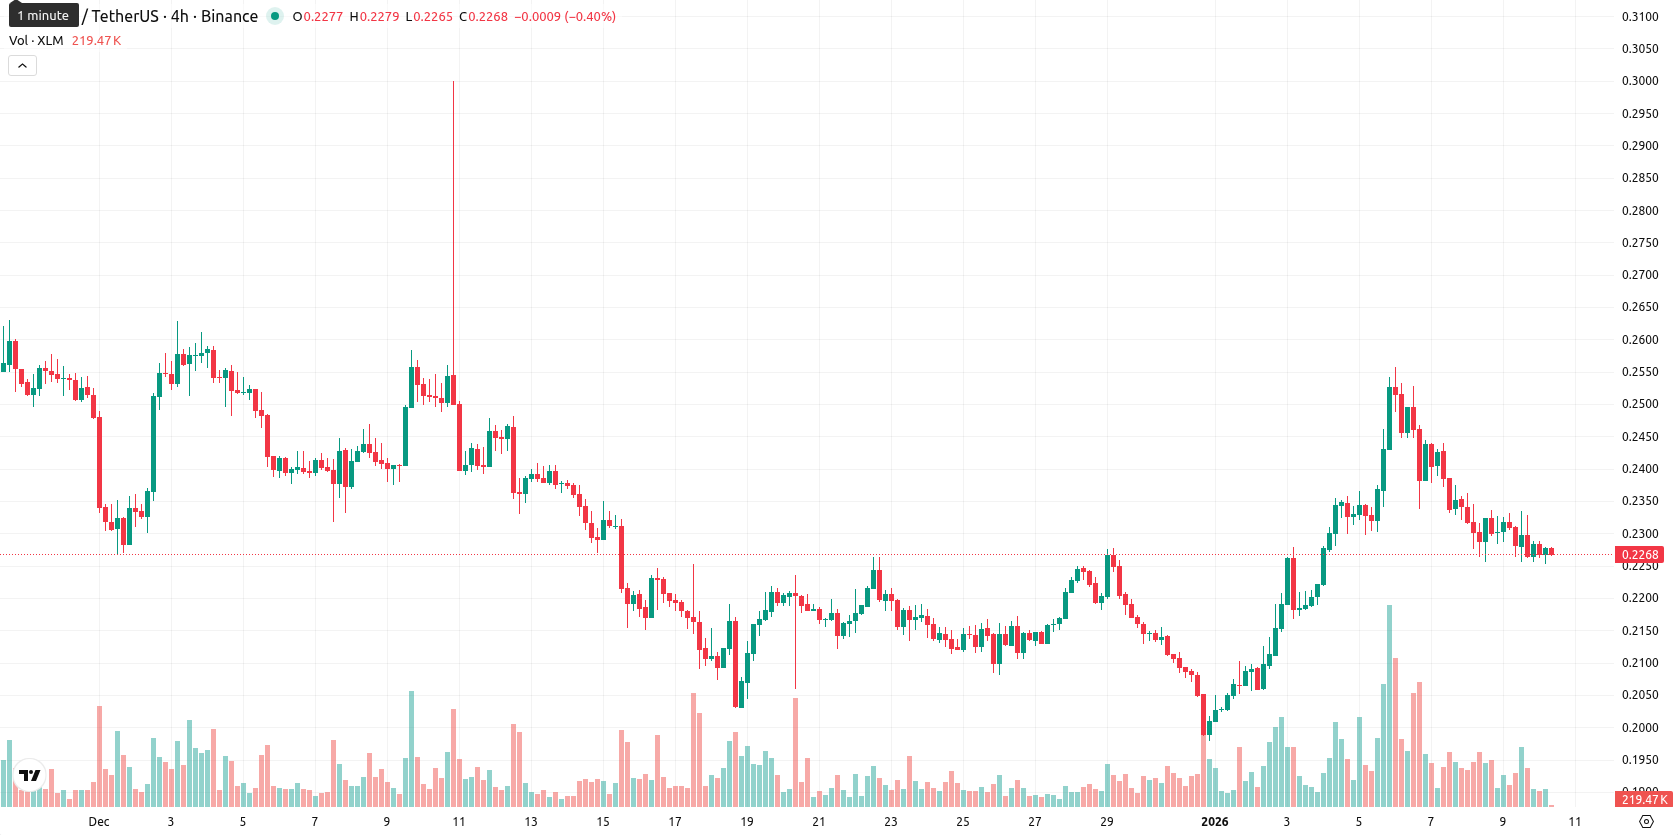
Stellar (XLM) is trading at $0.2266 after a weekly decline of 2.53%, moving closer to the weekly low of $0.2218 and well below both the MA-20 ($0.2971) and MA-50 ($0.3085). This sustained movement below key moving averages highlights continuing medium-term and long-term bearish pressure for the asset.
Highlights
- Stellar's real-world asset market capitalization surged 172% and total value locked exceeded $211 million in early 2024, signaling robust ecosystem growth.
- Developer activity increased 31% while the Stellar X-Ray privacy upgrade reached testnet, with governance votes for Protocol 24 and Protocol 25 ongoing.
- Institutional interest is building via ETF initiatives from Canary Capital and Bitwise, with additional Wall Street inflows expected if a Grayscale spot ETF is approved.
Ecosystem growth and ETF anticipation spur institutional focus this week
Stellar’s ecosystem began the year with notable growth, as real-world asset market capitalization soared by 172% and total value locked rose to over $211 million, alongside a 31% increase in developer activity. The ongoing Stellar X-Ray privacy upgrade reached the testnet stage, while governance votes for Protocol 24 and Protocol 25 are in progress. Institutional interest is supported by ETF initiatives from Canary Capital and Bitwise, with anticipated Wall Street capital flows if products like a Grayscale spot ETF receive approval.
Persistent bearish momentum as indicators and averages reinforce downside
On the weekly chart, XLM remains well beneath the MA-20 ($0.2971) and MA-50 ($0.3085), while the Ichimoku Kijun at $0.3403 serves as dynamic resistance. Support is established at the MA-200 ($0.1788). Momentum indicators convey persistent weakness, as the MACD provides a sell signal and the ADX (18.96) signals a weak trend. Oscillator readings show the RSI at 38 and CCI at –75, both in oversold territory, with the Stoch RSI neutral but nearing oversold. Bollinger Band Position and the Awesome Oscillator confirm a bearish bias, aligning with steady selling over the week. Price action, sitting closer to the weekly low than the high, underscores moderate volatility with heightened downside pressure.
Sideways consolidation expected as downtrend limits breakout potential
For the next 5–7 trading days, XLM is likely to trade between $0.2200 support and $0.2360 resistance, as the prevailing downtrend and weak momentum persist. The probability of a significant upward move remains low, with less than a 20% chance of a breakout above $0.2360. Price is thus expected to consolidate sideways within this range unless selling intensifies — in which case a break below $0.2200 could lead to new weekly lows.
Previously it was noted that Stellar was exhibiting strong short-term momentum as it traded above both its MA-20 and MA-50, but remained constrained by longer-term resistance at the MA-200. Mixed momentum indicators and elevated overbought readings suggested that price action is likely to consolidate sideways between dynamic support near $0.2489 and resistance around $0.25.


-
 Afghanistan
-
 Albania
-
 Algeria
-
 Angola
-
 Argentina
-
 Armenia
-
 Australia
-
 Austria
-
 Azerbaijan
-
 Bahamas
-
 Bahrain
-
 Bangladesh
-
 Belarus
-
 Belgium
-
 Bolivia
-
 Botswana
-
 Brazil
-
 Brunei
-
 Bulgaria
-
 Cambodia
-
 Cameroon
-
 Canada
-
 Chile
Chile
-
 China
China
-
 Colombia
-
 Congo
Congo
-
 Costa Rica
-
 Cote d'Ivoire
-
 Croatia
-
 Cuba
Cuba
-
 Cyprus
-
 Czechia
-
 DR Congo
-
 Denmark
-
 Dominican Republic
-
 Ecuador
-
 Egypt
Egypt
-
 El Salvador
-
 Estonia
-
 Eswatini
-
 Ethiopia
-
 Finland
-
 France
-
 Georgia
-
 Germany
-
 Ghana
Ghana
-
 Greece
-
 Haiti
Haiti
-
 Hong Kong
-
 Hungary
-
 India
India
-
 Indonesia
-
 Iran, Islamic republic
-
 Iraq
Iraq
-
 Ireland
-
 Israel
-
 Italy
Italy
-
 Jamaica
-
 Japan
Japan
-
 Jordan
-
 Kazakhstan
-
 Kenya
Kenya
-
 Korea
Korea
-
 Kuwait
-
 Kyrgyzstan
-
 Laos
Laos
-
 Latvia
-
 Lebanon
-
 Lesotho
-
 Libya
Libya
-
 Lithuania
-
 Luxembourg
-
 Madagascar
-
 Malaysia
-
 Malta
Malta
-
 Mauritius
-
 Mexico
-
 Moldova
-
 Mongolia
-
 Montenegro
-
 Morocco
-
 Mozambique
-
 Myanmar
-
 Namibia
-
 Nepal
Nepal
-
 Netherlands
-
 New Zealand
-
 Nigeria
-
 North Macedonia
-
 Norway
-
 Oman
Oman
-
 Pakistan
-
 Palestine
-
 Panama
-
 Papua New Guinea
-
 Paraguay
-
 Peru
Peru
-
 Philippines
-
 Poland
-
 Portugal
-
 Puerto Rico
-
 Qatar
Qatar
-
 Reunion
-
 Romania
-
 Rwanda
-
 Saudi Arabia
-
 Serbia
-
 Singapore
-
 Slovakia
-
 Slovenia
-
 Somalia
-
 South Africa
-
 Spain
Spain
-
 Sri Lanka
-
 Sweden
-
 Switzerland
-
 Syria
Syria
-
 Taiwan
-
 Tajikistan
-
 Tanzania
-
 Thailand
-
 Trinidad and Tobago
-
 Tunisia
-
 Turkey
-
 UAE
UAE
-
 Uganda
-
 Ukraine
-
 United Kingdom
-
United States
-
 Uruguay
-
 Uzbekistan
-
 Venezuela
-
 Vietnam
-
 Yemen
Yemen
-
 Zambia
-
 Zimbabwe
- Forex
- Crypto
