
XLM holds steady around recent range amid resistance at MA-50 and MA-200: weekly forecast

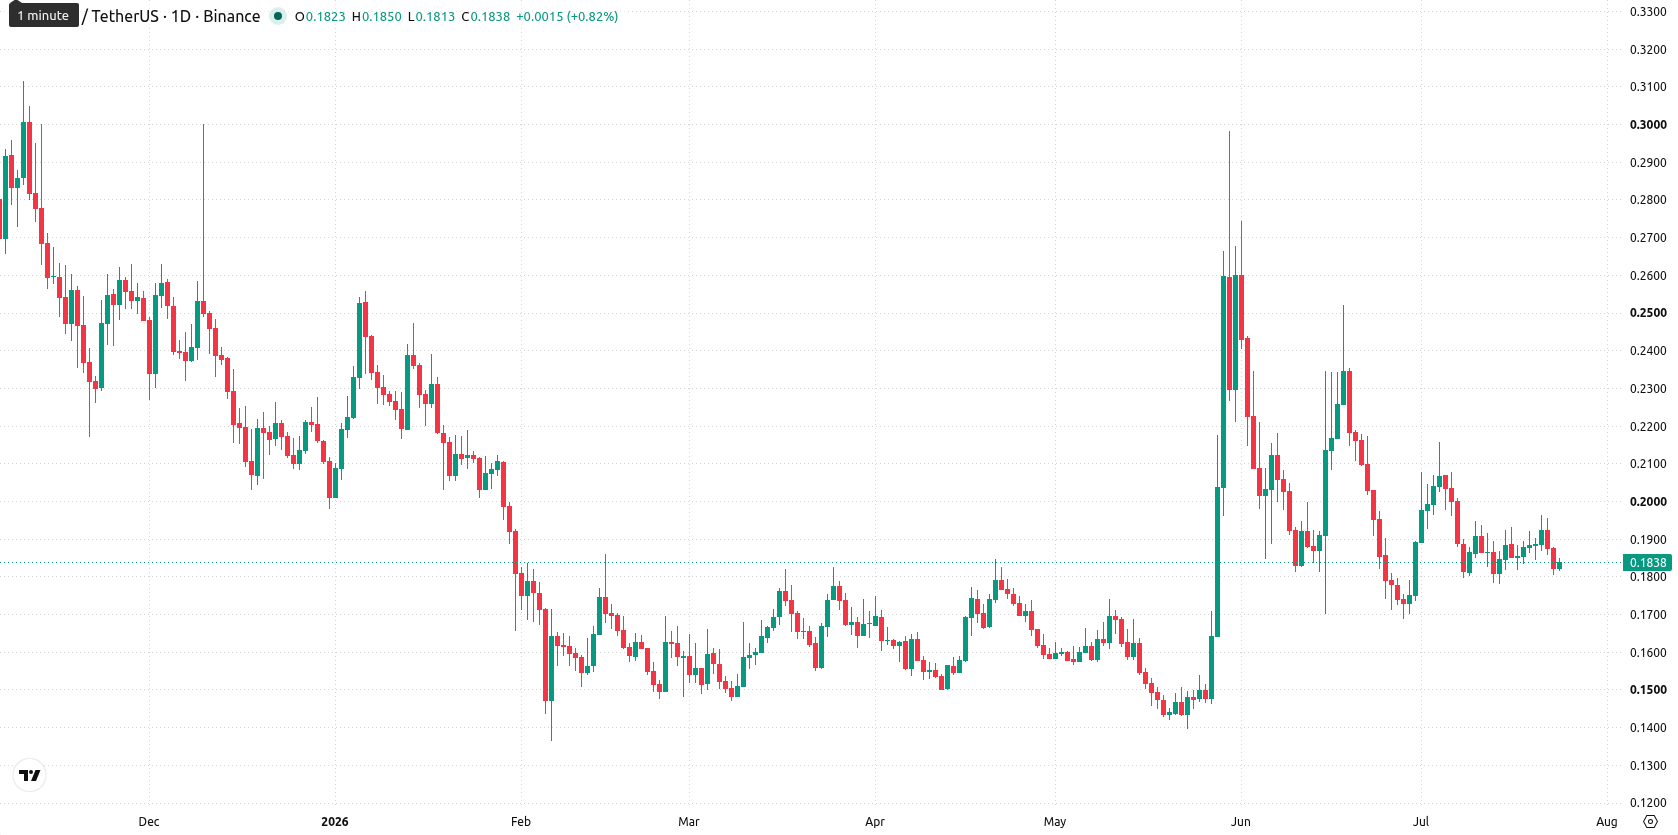
Stellar (XLM) is currently trading at $0.1835, having risen just $0.0001 (0.05%) over the past week. The asset sits slightly above its weekly MA-20 ($0.1782) but remains below the MA-50 ($0.2344) and MA-200 ($0.1837), indicating consolidation near support amid persistent medium- and long-term bearish trends.
 0.1833
0.1964
0.1833
0.1964
Highlights
- XLM shows heavy consolidation near key support after a muted 0.05% weekly increase, with sideways price action dominating.
- Mixed technical signals reveal prevailing bearish momentum, as XLM trades below its medium and long-term moving averages.
- The baseline scenario expects XLM to remain rangebound between $0.1675 and $0.1995, with a breakdown below $0.1675 opening further downside risk.
Institutional adoption and new partnerships drive positive sentiment this week
The Depository Trust & Clearing Corporation has adopted the Stellar blockchain for regulated asset tokenization, becoming the first major regulatory body to utilize a public blockchain for compliance-backed tokenization of securities and funds. This development highlights growing institutional interest and could facilitate the movement of assets such as Treasuries and money markets onchain. Additionally, Stellar has expanded its validator partner network with new collaborations, including MoneyGram and Figure Markets, which strengthens infrastructure reliability.
Mixed momentum and weak trend as consolidation dominates weekly technicals
On the weekly chart, XLM's price action reflects strong consolidation near the bottom of its seven-day range, with weekly volatility at 8.87%. The pair is supported by the MA-20 but faces resistance at the MA-50 and MA-200. Weekly momentum indicators are mixed: the MACD shows strong selling pressure, the ADX at 22.56 signals a weak but developing trend, and the RSI points to a 'Sell' rating while remaining neutral in terms of overbought or oversold extremes. The Stochastic RSI and CCI are neutral, while Bull/Bear Power slightly favors buyers, creating divergence among key oscillators.
Sideways or bearish outlook as key indicators limit upside for next week
XLM is expected to consolidate over the next seven days, likely trading within a range of $0.1675 – $0.1995. With only one out of four key weekly indicators signaling 'Buy' or 'Strong Buy,' the probability of a significant upward move is just 25%, making a sideways or slightly bearish scenario more likely. A sustained move above $0.1995 could spur further recovery if buyer momentum returns, while a drop below $0.1675 would indicate renewed control by sellers and could result in a test of lower support.
Earlier, analysts noted that Stellar was under persistent bearish momentum, with price action constrained below key technical averages and sentiment dependent on the risk of further downside. The current analysis adds a new dimension, as institutional adoption and network partnerships may improve long-term prospects, but traders should closely monitor whether consolidation above $0.1675 can hold amid continued volatility.








-
 Afghanistan
-
 Albania
-
 Algeria
-
 Angola
-
 Argentina
-
 Armenia
-
 Australia
-
 Austria
-
 Azerbaijan
-
 Bahamas
-
 Bahrain
-
 Bangladesh
-
 Belarus
-
 Belgium
-
 Bolivia
-
 Botswana
-
 Brazil
-
 Brunei
-
 Bulgaria
-
 Cambodia
-
 Cameroon
-
 Canada
-
 Chile
Chile
-
 China
China
-
 Colombia
-
 Congo
Congo
-
 Costa Rica
-
 Cote d'Ivoire
-
 Croatia
-
 Cuba
Cuba
-
 Cyprus
-
 Czechia
-
 DR Congo
-
 Denmark
-
 Dominican Republic
-
 Ecuador
-
 Egypt
Egypt
-
 El Salvador
-
 Estonia
-
 Eswatini
-
 Ethiopia
-
 Finland
-
 France
-
 Georgia
-
 Germany
-
 Ghana
Ghana
-
 Greece
-
 Haiti
Haiti
-
 Hong Kong
-
 Hungary
-
 India
India
-
 Indonesia
-
 Iran, Islamic republic
-
 Iraq
Iraq
-
 Ireland
-
 Israel
-
 Italy
Italy
-
 Jamaica
-
 Japan
Japan
-
 Jordan
-
 Kazakhstan
-
 Kenya
Kenya
-
 Korea
Korea
-
 Kuwait
-
 Kyrgyzstan
-
 Laos
Laos
-
 Latvia
-
 Lebanon
-
 Lesotho
-
 Libya
Libya
-
 Lithuania
-
 Luxembourg
-
 Madagascar
-
 Malaysia
-
 Malta
Malta
-
 Mauritius
-
 Mexico
-
 Moldova
-
 Mongolia
-
 Montenegro
-
 Morocco
-
 Mozambique
-
 Myanmar
-
 Namibia
-
 Nepal
Nepal
-
 Netherlands
-
 New Zealand
-
 Nigeria
-
 North Macedonia
-
 Norway
-
 Oman
Oman
-
 Pakistan
-
 Palestine
-
 Panama
-
 Papua New Guinea
-
 Paraguay
-
 Peru
Peru
-
 Philippines
-
 Poland
-
 Portugal
-
 Puerto Rico
-
 Qatar
Qatar
-
 Reunion
-
 Romania
-
 Rwanda
-
 Saudi Arabia
-
 Serbia
-
 Singapore
-
 Slovakia
-
 Slovenia
-
 Somalia
-
 South Africa
-
 Spain
Spain
-
 Sri Lanka
-
 Sweden
-
 Switzerland
-
 Syria
Syria
-
 Taiwan
-
 Tajikistan
-
 Tanzania
-
 Thailand
-
 Trinidad and Tobago
-
 Tunisia
-
 Turkey
-
 UAE
UAE
-
 Uganda
-
 Ukraine
-
 United Kingdom
-
United States
-
 Uruguay
-
 Uzbekistan
-
 Venezuela
-
 Vietnam
-
 Yemen
Yemen
-
 Zambia
-
 Zimbabwe
- Forex
- Crypto












