
-1.82% for Polygon — sideways action expected as volatility stays moderate

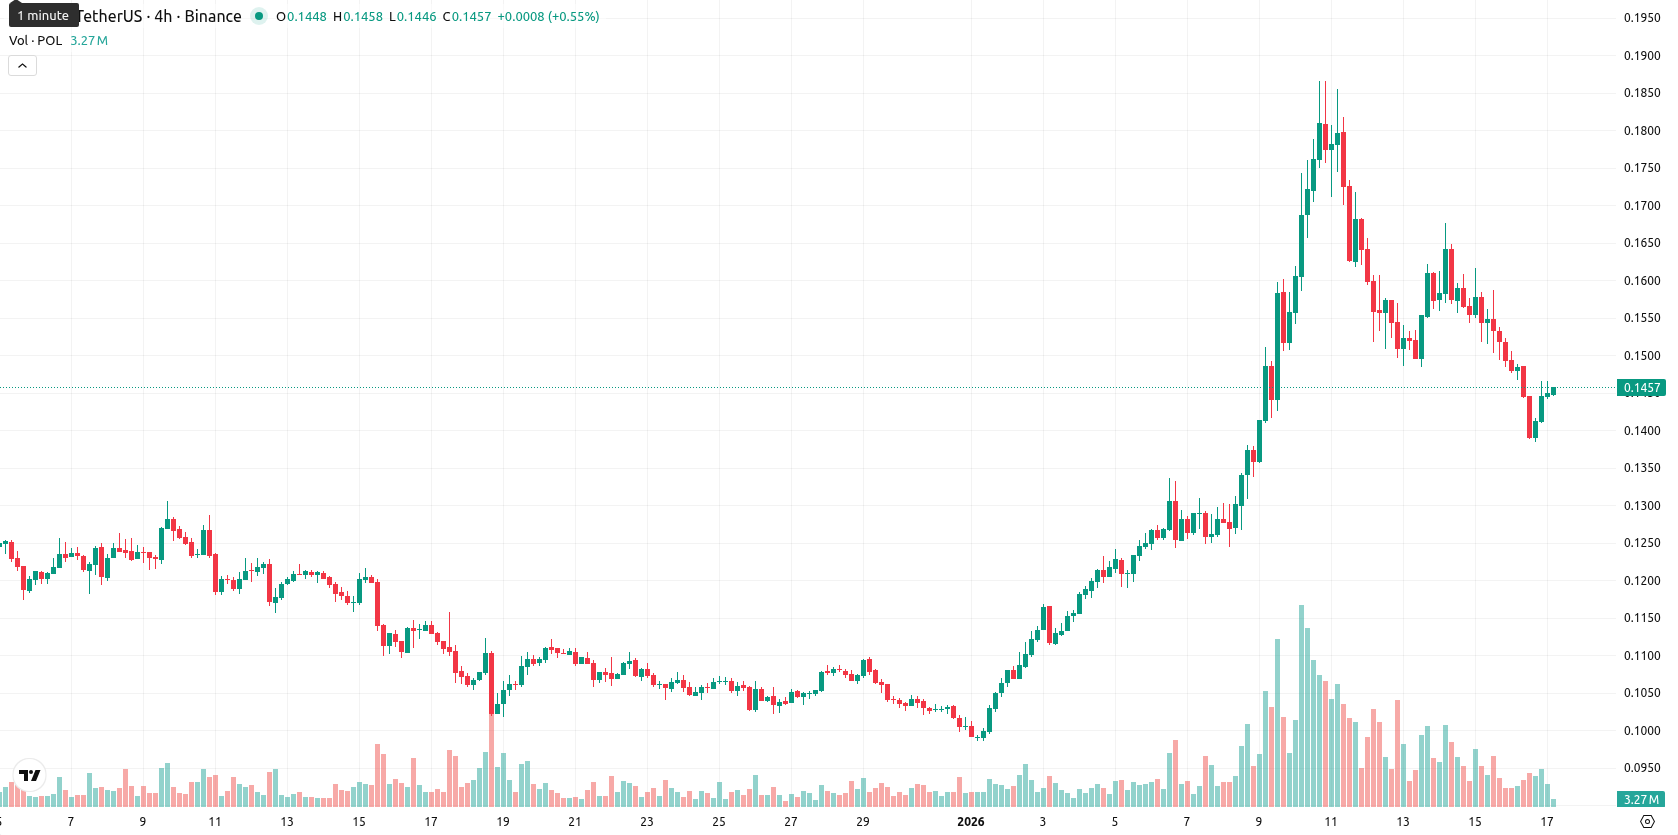
Polygon (POL, formerly MATIC) is trading at $0.1455, above the MA-20 ($0.1322) and MA-50 ($0.1233), yet remains well below the long-term MA-200 ($0.1935). This configuration suggests a short-term bullish tilt, but signals that longer-term selling pressure persists, with initial support offered by the Ichimoku Kijun level at $0.1426.
 0.0815
0.0855
0.0815
0.0855
Highlights
- Polygon laid off approximately 30% of its staff in January 2026 as part of a shift to a payments-first strategy.
- Polygon acquired Coinme and Sequence for over $250 million to enhance its U.S. regulatory standing and enable compliant stablecoin payments.
- Security researchers reported DeadLock ransomware group exploited Polygon smart contracts for proxy rotation, but found no direct risk to users or developers.
Restructuring and acquisitions reshape strategy amid regulatory pivot
Polygon has undergone major restructuring as it shifts toward a payments-first strategy, highlighted by the January 2026 layoff of roughly 30% of its staff after acquiring Coinme and Sequence for over $250 million. These purchases aim to strengthen Polygon's U.S. regulatory position and enable compliant, on-chain stablecoin payments by integrating fiat on-and-off ramp and cross-chain wallet infrastructure. Security researchers noted DeadLock ransomware group abusing Polygon smart contracts to rotate proxy servers, though no direct risk was found for everyday users or developers.
Buyer momentum diverges from mixed oscillators near resistance
On the technical side, POL is trading above its MA-20 and MA-50 levels, which indicates short-term momentum in favor of buyers, but it remains constrained beneath the MA-200, highlighting longer-term resistance. Key dynamic support is found at the Ichimoku Kijun ($0.1426). Among daily chart indicators, the ADX is strong and bullish, the MACD shows upward momentum, and the Bull/Bear Power suggests buyers are dominant intraday. However, the Stochastic RSI is oversold and the Awesome Oscillator reveals no clear, decisive trend, while the daily RSI sits moderately bullish at 56. This mix highlights a divergence between oversold oscillator readings and momentum indicators favoring the upside, with price currently near the day's midpoint ($0.1441–$0.1466) and volatility described as moderate and choppy.
Range trading likely as breakout probabilities remain subdued
Over the next five trading days, POL is expected to fluctuate within a typical volatility band of $0.1380 to $0.1520. The likelihood of a price increase remains low, at below 20%, so a further decline is more probable according to the current technical setup. The baseline scenario is for sideways movement within this range, while a sustained move above $0.1520 would indicate a bullish breakout and a drop under $0.1380 would expose POL to short-term support tests.
Last time, analysts noted that Polygon (POL) fell sharply this week, trading well below its key 20- and 50-week moving averages and showing persistent bearish momentum, with technical indicators like MACD and RSI signaling sustained downside pressure while oscillators remain mixed. The asset is expected to consolidate within a narrow range and faces ongoing resistance, with a recovery requiring a decisive weekly close above key resistance levels to reverse the current bearish bias.








-
 Afghanistan
-
 Albania
-
 Algeria
-
 Angola
-
 Argentina
-
 Armenia
-
 Australia
-
 Austria
-
 Azerbaijan
-
 Bahamas
-
 Bahrain
-
 Bangladesh
-
 Belarus
-
 Belgium
-
 Bolivia
-
 Botswana
-
 Brazil
-
 Brunei
-
 Bulgaria
-
 Cambodia
-
 Cameroon
-
 Canada
-
 Chile
Chile
-
 China
China
-
 Colombia
-
 Congo
Congo
-
 Costa Rica
-
 Cote d'Ivoire
-
 Croatia
-
 Cuba
Cuba
-
 Cyprus
-
 Czechia
-
 DR Congo
-
 Denmark
-
 Dominican Republic
-
 Ecuador
-
 Egypt
Egypt
-
 El Salvador
-
 Estonia
-
 Eswatini
-
 Ethiopia
-
 Finland
-
 France
-
 Georgia
-
 Germany
-
 Ghana
Ghana
-
 Greece
-
 Haiti
Haiti
-
 Hong Kong
-
 Hungary
-
 India
India
-
 Indonesia
-
 Iran, Islamic republic
-
 Iraq
Iraq
-
 Ireland
-
 Israel
-
 Italy
Italy
-
 Jamaica
-
 Japan
Japan
-
 Jordan
-
 Kazakhstan
-
 Kenya
Kenya
-
 Korea
Korea
-
 Kuwait
-
 Kyrgyzstan
-
 Laos
Laos
-
 Latvia
-
 Lebanon
-
 Lesotho
-
 Libya
Libya
-
 Lithuania
-
 Luxembourg
-
 Madagascar
-
 Malaysia
-
 Malta
Malta
-
 Mauritius
-
 Mexico
-
 Moldova
-
 Mongolia
-
 Montenegro
-
 Morocco
-
 Mozambique
-
 Myanmar
-
 Namibia
-
 Nepal
Nepal
-
 Netherlands
-
 New Zealand
-
 Nigeria
-
 North Macedonia
-
 Norway
-
 Oman
Oman
-
 Pakistan
-
 Palestine
-
 Panama
-
 Papua New Guinea
-
 Paraguay
-
 Peru
Peru
-
 Philippines
-
 Poland
-
 Portugal
-
 Puerto Rico
-
 Qatar
Qatar
-
 Reunion
-
 Romania
-
 Rwanda
-
 Saudi Arabia
-
 Serbia
-
 Singapore
-
 Slovakia
-
 Slovenia
-
 Somalia
-
 South Africa
-
 Spain
Spain
-
 Sri Lanka
-
 Sweden
-
 Switzerland
-
 Syria
Syria
-
 Taiwan
-
 Tajikistan
-
 Tanzania
-
 Thailand
-
 Trinidad and Tobago
-
 Tunisia
-
 Turkey
-
 UAE
UAE
-
 Uganda
-
 Ukraine
-
 United Kingdom
-
United States
-
 Uruguay
-
 Uzbekistan
-
 Venezuela
-
 Vietnam
-
 Yemen
Yemen
-
 Zambia
-
 Zimbabwe
- Forex
- Crypto











