
TRUMP holds steady as weak momentum and oversold signals limit gains

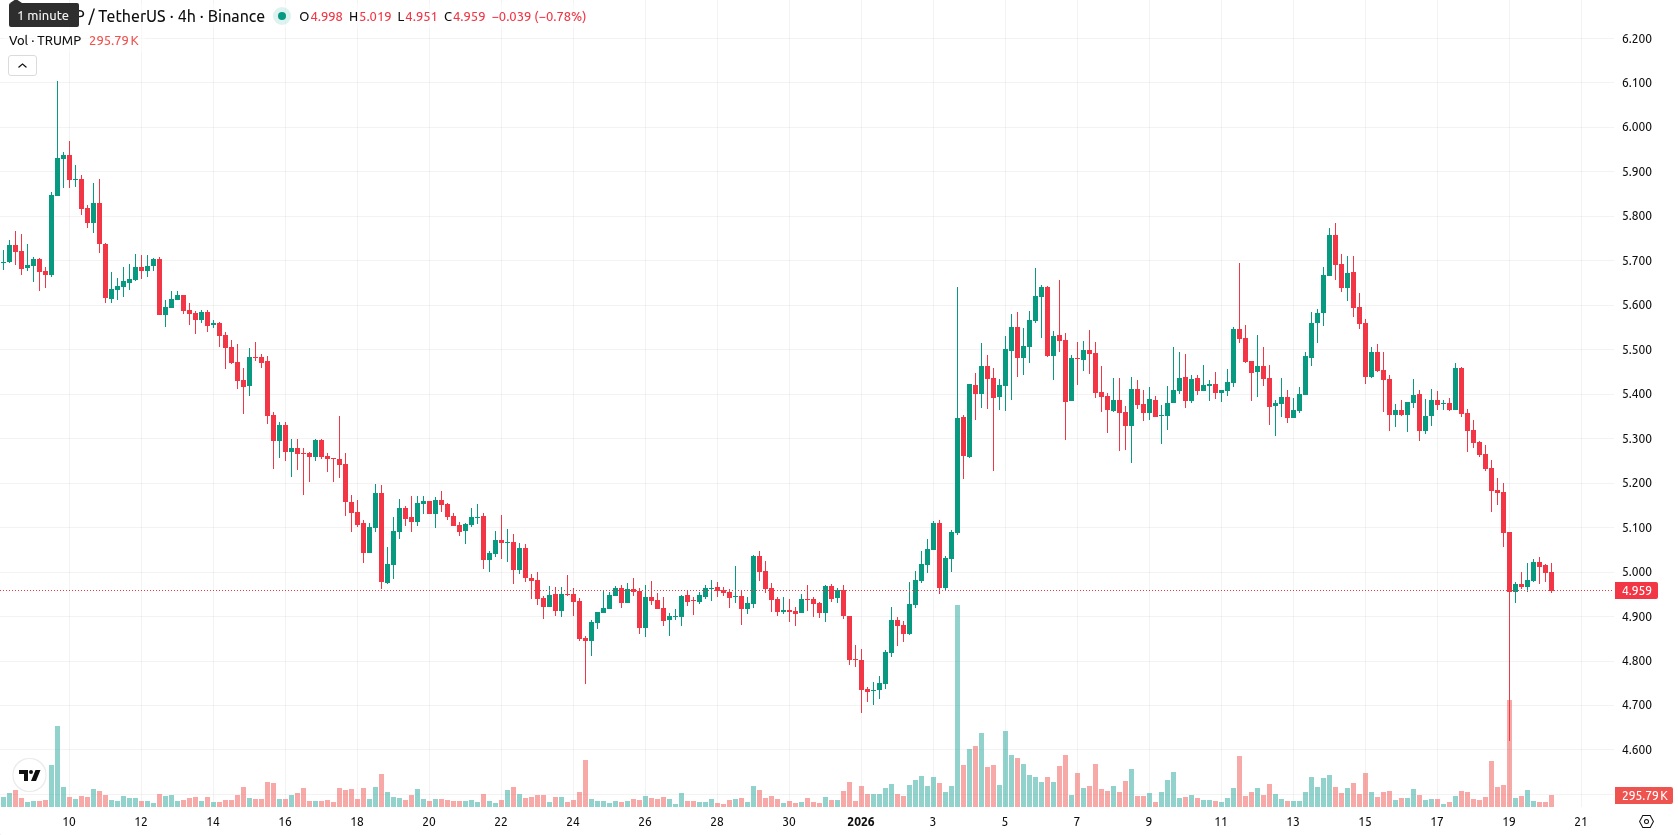
Official Trump (TRUMP) is currently trading at $4.96, which sits below the key Moving Averages — MA-20 ($5.31), MA-50 ($5.34), and MA-200 ($7.41). This structure signals ongoing short-, medium-, and long-term pressure from sellers with no immediate reversal, while the nearest dynamic resistance is around the Ichimoku Kijun level of $5.19.
Highlights
- TRUMP trades at $4.96, below MA-20 ($5.31), MA-50 ($5.34), and MA-200 ($7.41), signaling persistent selling pressure across all time frames.
- Momentum indicators remain weak, with RSI at 39.35, Stochastic RSI at zero, and CCI at –148.63, highlighting an oversold environment and bearish bias.
- Expected five-day price range is $4.60–$5.15, with less than 20% probability of a price increase and consolidation or downside favored barring a move above $5.19.
Oversold signals and flat momentum amid narrow trading range
Momentum remains soft as both the MACD (neutral with a slight negative bias) and ADX (neutral, 18.07) suggest trend weakness. Oscillators show the market is oversold, with the RSI at 39.35, Stochastic RSI at zero, and CCI at –148.63. Bull/Bear Power also points to seller dominance as it signals an oversold environment. There was no price gap at the open, and the current price sits at the lower end of today’s $4.97 – $5.02 range. Volatility is low and intraday tone is consolidative, with a flat daily move and momentum indicators broadly in agreement.
Further downside risk as bearish momentum meets weak upside odds
For the next five trading days, the expected price range is adjusted to $4.60 – $5.15 to reflect typical volatility relative to current levels. The probability of a price increase is very low (less than 20%), as all major weekly indicators signal further downside momentum, making a decline much more likely. The baseline scenario is continued sideways consolidation within the range. A bullish scenario would require a lift above Ichimoku Kijun resistance at $5.19, while a bearish move could see the price slip below the $4.60 support zone, guided by oversold conditions and prevailing selling pressure.
Previously it was reported that Official Trump is trading below key moving averages with sustained bearish momentum, as sellers dominate and price action remains near daily lows. Despite some oversold technical signals, prevailing indicators including the RSI, CCI, and ADX suggest further downside or range-bound movement unless resistance at $5.23 is overcome.


Latest TRUMP News


-
 Afghanistan
-
 Albania
-
 Algeria
-
 Angola
-
 Argentina
-
 Armenia
-
 Australia
-
 Austria
-
 Azerbaijan
-
 Bahamas
-
 Bahrain
-
 Bangladesh
-
 Belarus
-
 Belgium
-
 Bolivia
-
 Botswana
-
 Brazil
-
 Brunei
-
 Bulgaria
-
 Cambodia
-
 Cameroon
-
 Canada
-
 Chile
Chile
-
 China
China
-
 Colombia
-
 Congo
Congo
-
 Costa Rica
-
 Cote d'Ivoire
-
 Croatia
-
 Cuba
Cuba
-
 Cyprus
-
 Czechia
-
 DR Congo
-
 Denmark
-
 Dominican Republic
-
 Ecuador
-
 Egypt
Egypt
-
 El Salvador
-
 Estonia
-
 Eswatini
-
 Ethiopia
-
 Finland
-
 France
-
 Georgia
-
 Germany
-
 Ghana
Ghana
-
 Greece
-
 Haiti
Haiti
-
 Hong Kong
-
 Hungary
-
 India
India
-
 Indonesia
-
 Iran, Islamic republic
-
 Iraq
Iraq
-
 Ireland
-
 Israel
-
 Italy
Italy
-
 Jamaica
-
 Japan
Japan
-
 Jordan
-
 Kazakhstan
-
 Kenya
Kenya
-
 Korea
Korea
-
 Kuwait
-
 Kyrgyzstan
-
 Laos
Laos
-
 Latvia
-
 Lebanon
-
 Lesotho
-
 Libya
Libya
-
 Lithuania
-
 Luxembourg
-
 Madagascar
-
 Malaysia
-
 Malta
Malta
-
 Mauritius
-
 Mexico
-
 Moldova
-
 Mongolia
-
 Montenegro
-
 Morocco
-
 Mozambique
-
 Myanmar
-
 Namibia
-
 Nepal
Nepal
-
 Netherlands
-
 New Zealand
-
 Nigeria
-
 North Macedonia
-
 Norway
-
 Oman
Oman
-
 Pakistan
-
 Palestine
-
 Panama
-
 Papua New Guinea
-
 Paraguay
-
 Peru
Peru
-
 Philippines
-
 Poland
-
 Portugal
-
 Puerto Rico
-
 Qatar
Qatar
-
 Reunion
-
 Romania
-
 Rwanda
-
 Saudi Arabia
-
 Serbia
-
 Singapore
-
 Slovakia
-
 Slovenia
-
 Somalia
-
 South Africa
-
 Spain
Spain
-
 Sri Lanka
-
 Sweden
-
 Switzerland
-
 Syria
Syria
-
 Taiwan
-
 Tajikistan
-
 Tanzania
-
 Thailand
-
 Trinidad and Tobago
-
 Tunisia
-
 Turkey
-
 UAE
UAE
-
 Uganda
-
 Ukraine
-
 United Kingdom
-
United States
-
 Uruguay
-
 Uzbekistan
-
 Venezuela
-
 Vietnam
-
 Yemen
Yemen
-
 Zambia
-
 Zimbabwe
- Forex
- Crypto
