
TRUMP slides 5.41% as sellers keep control below key support levels

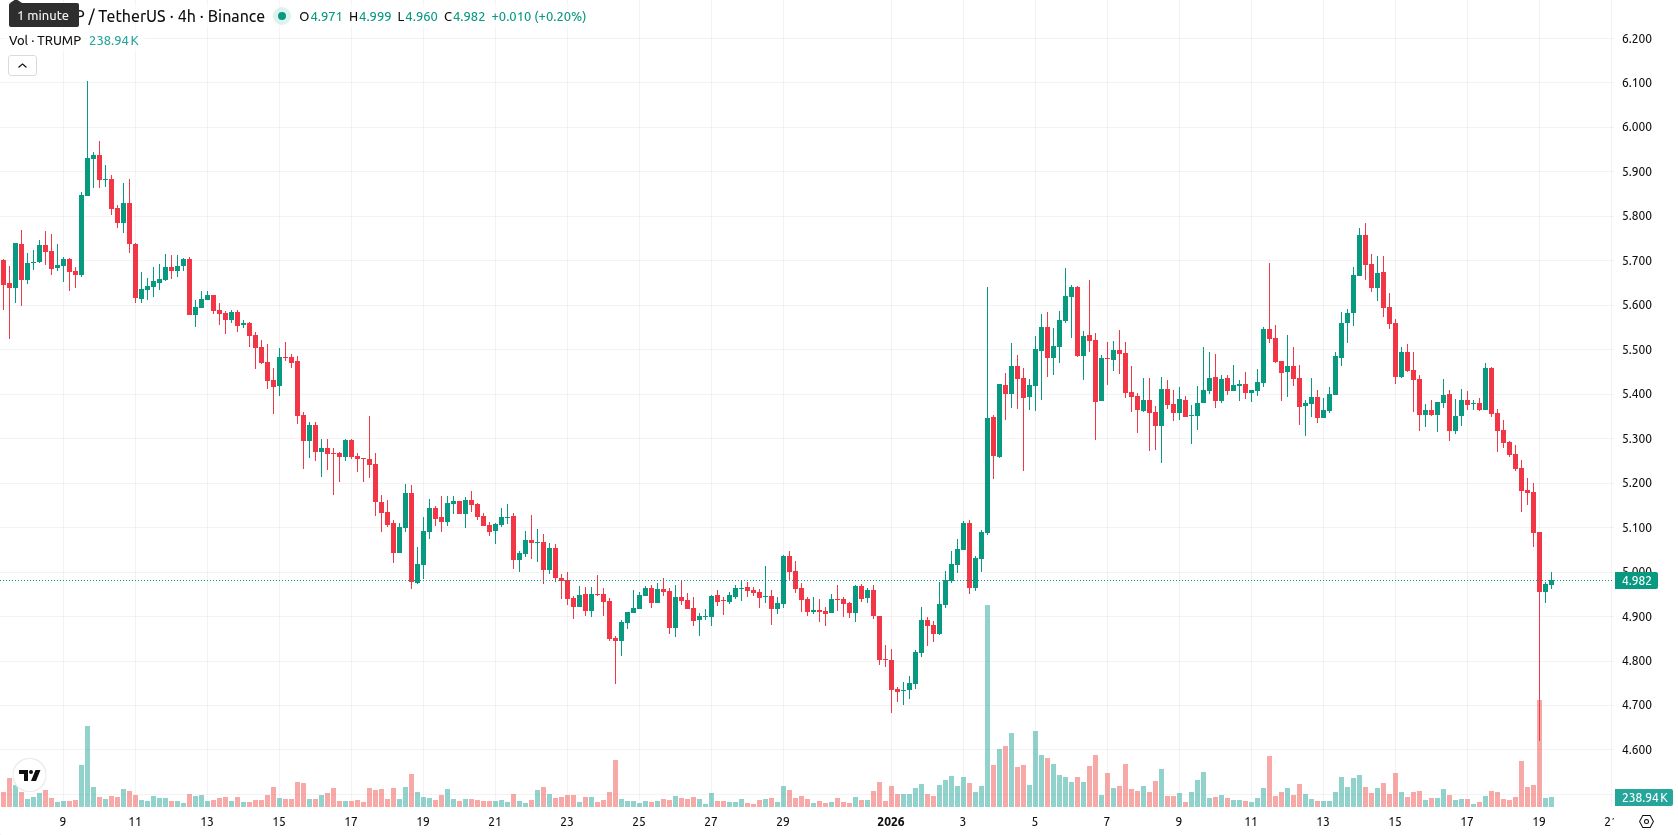
Official Trump (TRUMP) is trading at $4.98 today, reflecting another day of acute downside pressure with a daily drop of 5.41%. TRUMP is currently positioned below its MA-20 ($5.31), MA-50 ($5.36), and well beneath the MA-200 ($7.43), underscoring short- and medium-term momentum in favor of sellers.
Highlights
- TRUMP traded at $4.98, falling 5.41% on the day and closing below MA-20 ($5.31), MA-50 ($5.36), and MA-200 ($7.43), confirming pronounced downward momentum.
- Daily momentum indicators are predominantly bearish with RSI at 42.44, Stochastic RSI oversold, and Bull/Bear Power favoring sellers, despite a strong buy signal from the MACD.
- The expected trading range for the coming week is $4.60 to $5.10, with probability of a price increase under 20% and further downside likely unless TRUMP closes above $5.23.
Oversold signals clash with bearish momentum as sellers dominate
Sellers currently have control as TRUMP displays pronounced weakness beneath key moving averages, with the nearest dynamic resistance at the Ichimoku Kijun ($5.23). The daily MACD is a lone bullish outlier, but other momentum indicators (ADX neutral, RSI 42.44 and CCI bearish, Stochastic RSI oversold, and Awesome Oscillator neutral) signal prevailing downside momentum and high intraday volatility. With price action concentrated near daily lows and a lack of immediate support, a clear divergence emerges as oversold signals clash with persistent bearish readings, confirming the dominance of sellers according to Bull/Bear Power.
Range-bound drift expected as bearish momentum constrains recovery
Over the coming week, TRUMP is expected to fluctuate in the $4.60 to $5.10 range, a volatility band relative to current levels. Most indicators, including weekly RSI, ADX, and MACD, continue to point strongly bearish, supporting a baseline scenario of further sideways drift near the lower end of this band. Bullish momentum would require a close above $5.23 to enable a recovery attempt toward the $5.10 area, while a breakdown below $4.60 could prompt increased selling and accelerate the decline.
Previously it was reported that Official Trump is trading in a narrow range above short-term support and below medium-term resistance, with mixed momentum indicators suggesting limited upside potential amid prevailing bearish signals. The price is constrained by technical resistance at the MA-50 and support at the Ichimoku Kijun, while neutral RSI and MACD readings reinforce expectations for continued consolidation unless a decisive breakout occurs.


Latest TRUMP News


-
 Afghanistan
-
 Albania
-
 Algeria
-
 Angola
-
 Argentina
-
 Armenia
-
 Australia
-
 Austria
-
 Azerbaijan
-
 Bahamas
-
 Bahrain
-
 Bangladesh
-
 Belarus
-
 Belgium
-
 Bolivia
-
 Botswana
-
 Brazil
-
 Brunei
-
 Bulgaria
-
 Cambodia
-
 Cameroon
-
 Canada
-
 Chile
Chile
-
 China
China
-
 Colombia
-
 Congo
Congo
-
 Costa Rica
-
 Cote d'Ivoire
-
 Croatia
-
 Cuba
Cuba
-
 Cyprus
-
 Czechia
-
 DR Congo
-
 Denmark
-
 Dominican Republic
-
 Ecuador
-
 Egypt
Egypt
-
 El Salvador
-
 Estonia
-
 Eswatini
-
 Ethiopia
-
 Finland
-
 France
-
 Georgia
-
 Germany
-
 Ghana
Ghana
-
 Greece
-
 Haiti
Haiti
-
 Hong Kong
-
 Hungary
-
 India
India
-
 Indonesia
-
 Iran, Islamic republic
-
 Iraq
Iraq
-
 Ireland
-
 Israel
-
 Italy
Italy
-
 Jamaica
-
 Japan
Japan
-
 Jordan
-
 Kazakhstan
-
 Kenya
Kenya
-
 Korea
Korea
-
 Kuwait
-
 Kyrgyzstan
-
 Laos
Laos
-
 Latvia
-
 Lebanon
-
 Lesotho
-
 Libya
Libya
-
 Lithuania
-
 Luxembourg
-
 Madagascar
-
 Malaysia
-
 Malta
Malta
-
 Mauritius
-
 Mexico
-
 Moldova
-
 Mongolia
-
 Montenegro
-
 Morocco
-
 Mozambique
-
 Myanmar
-
 Namibia
-
 Nepal
Nepal
-
 Netherlands
-
 New Zealand
-
 Nigeria
-
 North Macedonia
-
 Norway
-
 Oman
Oman
-
 Pakistan
-
 Palestine
-
 Panama
-
 Papua New Guinea
-
 Paraguay
-
 Peru
Peru
-
 Philippines
-
 Poland
-
 Portugal
-
 Puerto Rico
-
 Qatar
Qatar
-
 Reunion
-
 Romania
-
 Rwanda
-
 Saudi Arabia
-
 Serbia
-
 Singapore
-
 Slovakia
-
 Slovenia
-
 Somalia
-
 South Africa
-
 Spain
Spain
-
 Sri Lanka
-
 Sweden
-
 Switzerland
-
 Syria
Syria
-
 Taiwan
-
 Tajikistan
-
 Tanzania
-
 Thailand
-
 Trinidad and Tobago
-
 Tunisia
-
 Turkey
-
 UAE
UAE
-
 Uganda
-
 Ukraine
-
 United Kingdom
-
United States
-
 Uruguay
-
 Uzbekistan
-
 Venezuela
-
 Vietnam
-
 Yemen
Yemen
-
 Zambia
-
 Zimbabwe
- Forex
- Crypto
