
Stability for TRUMP — technical resistance meets subdued bullish signals

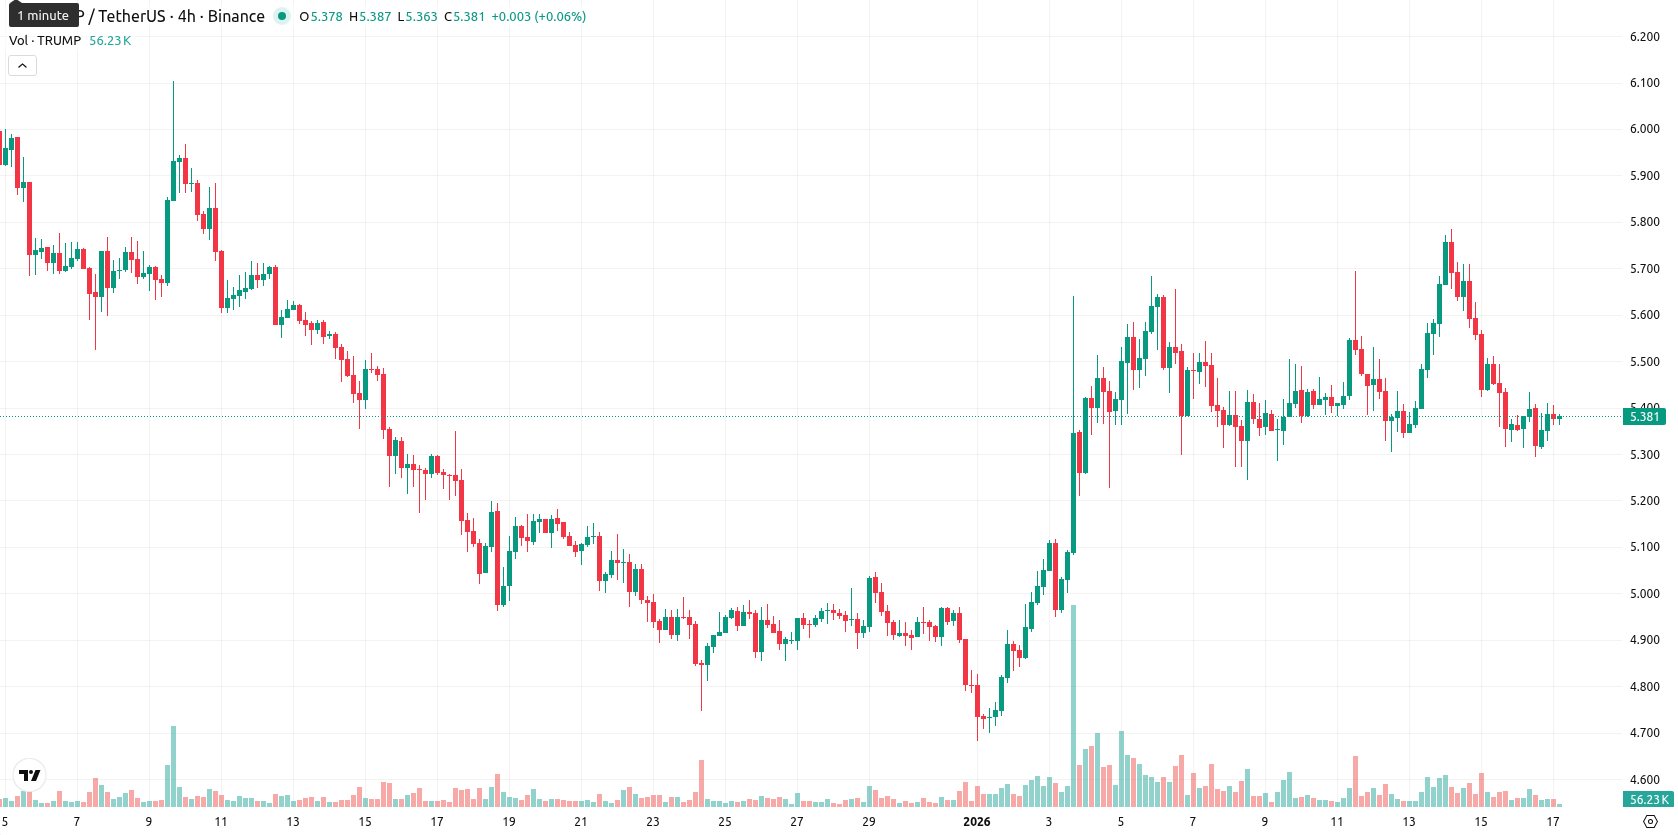
Official Trump (TRUMP) is trading at $5.38 with a daily move of 0.45%, staying above the MA-20 ($5.28) but slightly below the MA-50 ($5.40). This puts it in a short-term supportive position, while medium-term resistance persists.
Highlights
- TRUMP trades at $5.38, above the MA-20 ($5.28) but just below MA-50 ($5.40) and well under MA-200 ($7.46), signaling long-term bearish pressure.
- Momentum indicators are mixed, with the MACD mildly bullish, ADX and RSI neutral, and short-term Stochastic RSI and Bull/Bear Power showing oversold, buyer-dominated conditions.
- Consolidation is likely between $5.23 support and $5.40 resistance, with less than 20% probability of exceeding $5.40 and downside risk toward $5.10 if $5.23 fails.
Mixed momentum highlights short-term buying amid long-term bearishness
From a technical perspective, TRUMP is positioned above its MA-20 but slightly under the MA-50, signaling short-term support yet encountering medium-term resistance. The price remains far beneath the MA-200 ($7.46), confirming the lasting bearish tone, with the Ichimoku Kijun at $5.23 as primary support and the MA-50 at $5.40 as immediate resistance. Momentum indicators are mixed: the MACD on D1 suggests mild bullishness, the ADX reads neutral, and the RSI sits in the neutral zone. Meanwhile, Stochastic RSI and Bull/Bear Power both show oversold conditions and active short-term buyer dominance, although medium- and long-term signals point downward as volatility remains limited and direction unclear.
Limited upside outlook as volatility confines price direction
In the coming week, price action is likely to remain constrained, with a typical volatility band between $5.10 and $5.58 and most trading expected near the current range. Consolidation between support at $5.23 and resistance at $5.40 is the baseline scenario. The probability of meaningful upward momentum remains below 20%, with weekly signals from RSI, ADX, and MACD continuing to point modestly lower. A strong bullish move would require a breakout above $5.40, targeting $5.58, while a breach under $5.23 could see a dip to $5.10.
Last time, analysts noted that Official Trump was trading just above its 20-day moving average and near its 50-day moving average, with the price facing resistance below the 200-day trendline and support from buyers near Ichimoku Kijun. Mixed technical signals, including neutral readings from the RSI and CCI and weak trend strength on the ADX, suggest a narrow trading range is likely, with downside risks heightened if support near $5.23 fails to hold.


Latest TRUMP News


-
 Afghanistan
-
 Albania
-
 Algeria
-
 Angola
-
 Argentina
-
 Armenia
-
 Australia
-
 Austria
-
 Azerbaijan
-
 Bahamas
-
 Bahrain
-
 Bangladesh
-
 Belarus
-
 Belgium
-
 Bolivia
-
 Botswana
-
 Brazil
-
 Brunei
-
 Bulgaria
-
 Cambodia
-
 Cameroon
-
 Canada
-
 Chile
Chile
-
 China
China
-
 Colombia
-
 Congo
Congo
-
 Costa Rica
-
 Cote d'Ivoire
-
 Croatia
-
 Cuba
Cuba
-
 Cyprus
-
 Czechia
-
 DR Congo
-
 Denmark
-
 Dominican Republic
-
 Ecuador
-
 Egypt
Egypt
-
 El Salvador
-
 Estonia
-
 Eswatini
-
 Ethiopia
-
 Finland
-
 France
-
 Georgia
-
 Germany
-
 Ghana
Ghana
-
 Greece
-
 Haiti
Haiti
-
 Hong Kong
-
 Hungary
-
 India
India
-
 Indonesia
-
 Iran, Islamic republic
-
 Iraq
Iraq
-
 Ireland
-
 Israel
-
 Italy
Italy
-
 Jamaica
-
 Japan
Japan
-
 Jordan
-
 Kazakhstan
-
 Kenya
Kenya
-
 Korea
Korea
-
 Kuwait
-
 Kyrgyzstan
-
 Laos
Laos
-
 Latvia
-
 Lebanon
-
 Lesotho
-
 Libya
Libya
-
 Lithuania
-
 Luxembourg
-
 Madagascar
-
 Malaysia
-
 Malta
Malta
-
 Mauritius
-
 Mexico
-
 Moldova
-
 Mongolia
-
 Montenegro
-
 Morocco
-
 Mozambique
-
 Myanmar
-
 Namibia
-
 Nepal
Nepal
-
 Netherlands
-
 New Zealand
-
 Nigeria
-
 North Macedonia
-
 Norway
-
 Oman
Oman
-
 Pakistan
-
 Palestine
-
 Panama
-
 Papua New Guinea
-
 Paraguay
-
 Peru
Peru
-
 Philippines
-
 Poland
-
 Portugal
-
 Puerto Rico
-
 Qatar
Qatar
-
 Reunion
-
 Romania
-
 Rwanda
-
 Saudi Arabia
-
 Serbia
-
 Singapore
-
 Slovakia
-
 Slovenia
-
 Somalia
-
 South Africa
-
 Spain
Spain
-
 Sri Lanka
-
 Sweden
-
 Switzerland
-
 Syria
Syria
-
 Taiwan
-
 Tajikistan
-
 Tanzania
-
 Thailand
-
 Trinidad and Tobago
-
 Tunisia
-
 Turkey
-
 UAE
UAE
-
 Uganda
-
 Ukraine
-
 United Kingdom
-
United States
-
 Uruguay
-
 Uzbekistan
-
 Venezuela
-
 Vietnam
-
 Yemen
Yemen
-
 Zambia
-
 Zimbabwe
- Forex
- Crypto
