
TRUMP price prediction: Sideways risk as TRUMP loses 2.48%

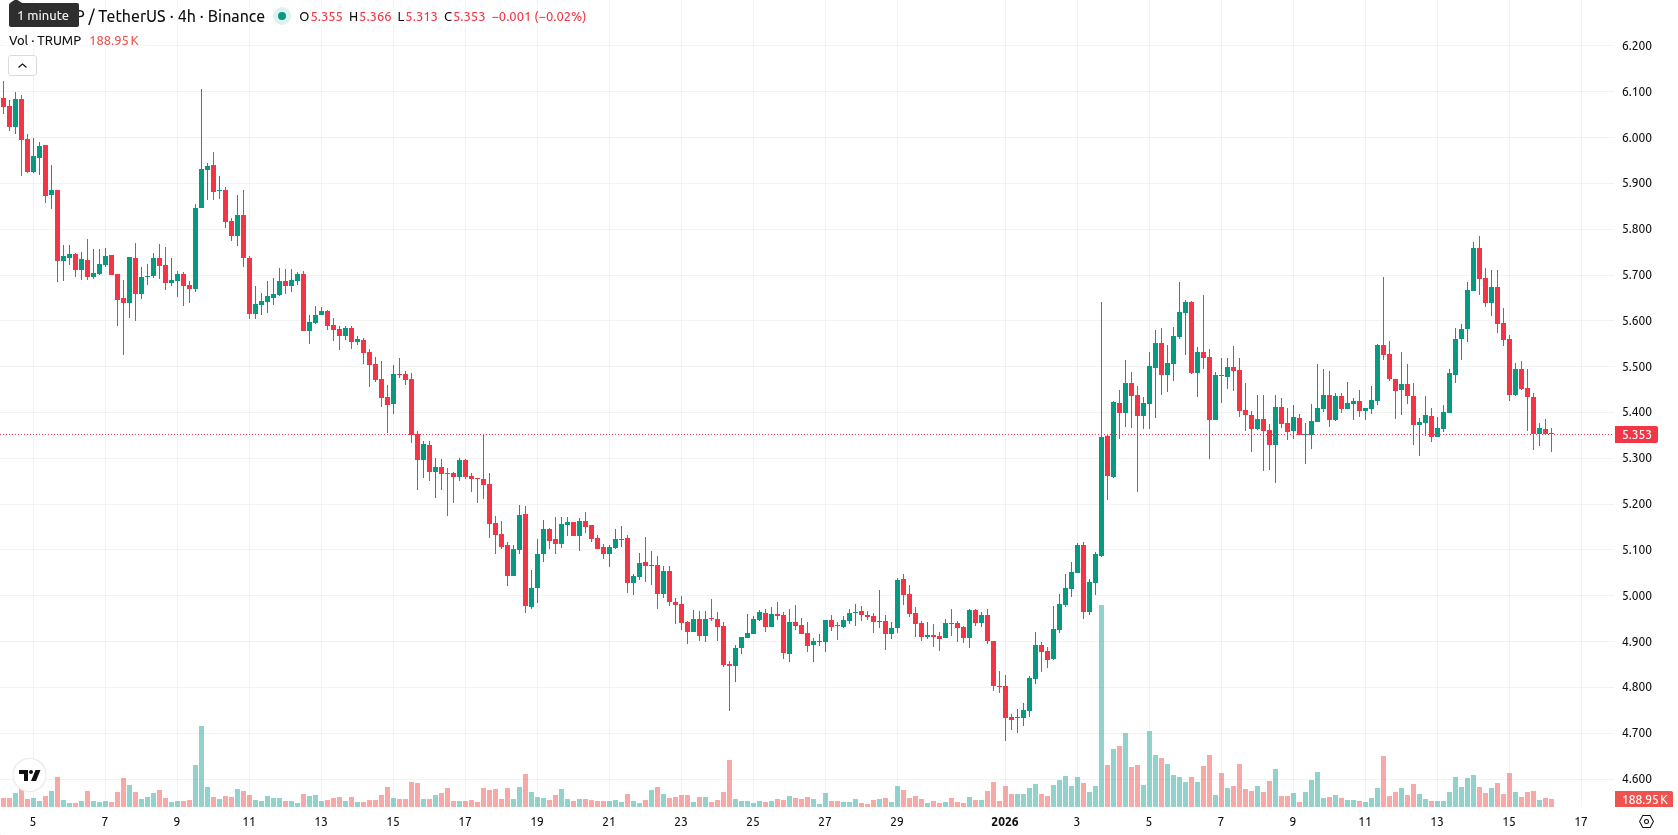
Official Trump (TRUMP) is trading at $5.35, holding above its MA-20 ($5.26), just beneath MA-50 ($5.41), and well below MA-200 ($7.48). Short-term price action indicates support from buyers, but medium- and long-term momentum remains challenged by selling pressure — TRUMP is currently situated near key moving averages, with buyers attempting to hold above Ichimoku Kijun support ($5.23).
Highlights
- TRUMP is trading at $5.35, positioned above its MA-20 ($5.26) but below its MA-50 ($5.41) and MA-200 ($7.48), signaling ongoing medium- and long-term bearish pressure.
- Today’s price has declined 2.48%, and intraday signals are mixed with the RSI at 49.74, ADX at 20.05, and a mild upward bias indicated by Bull/Bear Power (0.18) and the Awesome Oscillator.
- Next 5 trading days are expected to see TRUMP range between $5.00 and $5.50, with less than 20% probability of an upward move and prevailing bearish weekly signals from RSI, ADX, and MACD.
Conflicting momentum signals as technical boundaries narrow outlook
Momentum signals for TRUMP are mixed: the MACD indicates mild bullish momentum on the daily timeframe, while the ADX is at 20.05, reflecting only modest trend strength. The RSI (49.74) and CCI (42.24) both indicate a neutral bias. Stochastic RSI signals a neutral-to-slightly bearish tone in most intraday intervals, though it occasionally reaches overbought or oversold conditions. Bull/Bear Power remains positive (0.18), signaling a slight advantage for buyers intraday, and the Awesome Oscillator suggests a mild upward bias on the daily chart. Dynamic support comes in at the Ichimoku Kijun ($5.23) with near-term resistance at MA-50 ($5.41). The overall configuration indicates conflicting momentum among short-term indicators, producing an uncertain intraday outlook for TRUMP.
Bearish weekly momentum raises downside risk over consolidation
Over the next 5 trading days, TRUMP is likely to remain within the $5.00 to $5.50 volatility band relative to current levels. The probability of a price increase is low (less than 20%), and the greater risk is to the downside, given the prevailing bearish weekly signals from RSI, ADX, and MACD. The base scenario is a sideways move between $5.00 and $5.50. A break over $5.41 could prompt a short-term rally, while a fall below $5.23 would increase downside momentum toward the lower end of the current band.
Previously it was reported that Official Trump exhibits short- to medium-term bullish momentum, trading above its 20- and 50-day moving averages but remaining under long-term pressure below the 200-day average. Mixed momentum signals, with overbought oscillators offsetting modest bullish indicators, point to tightening consolidation and elevated downside risk unless support near $5.23 holds.


Latest TRUMP News


-
 Afghanistan
-
 Albania
-
 Algeria
-
 Angola
-
 Argentina
-
 Armenia
-
 Australia
-
 Austria
-
 Azerbaijan
-
 Bahamas
-
 Bahrain
-
 Bangladesh
-
 Belarus
-
 Belgium
-
 Bolivia
-
 Botswana
-
 Brazil
-
 Brunei
-
 Bulgaria
-
 Cambodia
-
 Cameroon
-
 Canada
-
 Chile
Chile
-
 China
China
-
 Colombia
-
 Congo
Congo
-
 Costa Rica
-
 Cote d'Ivoire
-
 Croatia
-
 Cuba
Cuba
-
 Cyprus
-
 Czechia
-
 DR Congo
-
 Denmark
-
 Dominican Republic
-
 Ecuador
-
 Egypt
Egypt
-
 El Salvador
-
 Estonia
-
 Eswatini
-
 Ethiopia
-
 Finland
-
 France
-
 Georgia
-
 Germany
-
 Ghana
Ghana
-
 Greece
-
 Haiti
Haiti
-
 Hong Kong
-
 Hungary
-
 India
India
-
 Indonesia
-
 Iran, Islamic republic
-
 Iraq
Iraq
-
 Ireland
-
 Israel
-
 Italy
Italy
-
 Jamaica
-
 Japan
Japan
-
 Jordan
-
 Kazakhstan
-
 Kenya
Kenya
-
 Korea
Korea
-
 Kuwait
-
 Kyrgyzstan
-
 Laos
Laos
-
 Latvia
-
 Lebanon
-
 Lesotho
-
 Libya
Libya
-
 Lithuania
-
 Luxembourg
-
 Madagascar
-
 Malaysia
-
 Malta
Malta
-
 Mauritius
-
 Mexico
-
 Moldova
-
 Mongolia
-
 Montenegro
-
 Morocco
-
 Mozambique
-
 Myanmar
-
 Namibia
-
 Nepal
Nepal
-
 Netherlands
-
 New Zealand
-
 Nigeria
-
 North Macedonia
-
 Norway
-
 Oman
Oman
-
 Pakistan
-
 Palestine
-
 Panama
-
 Papua New Guinea
-
 Paraguay
-
 Peru
Peru
-
 Philippines
-
 Poland
-
 Portugal
-
 Puerto Rico
-
 Qatar
Qatar
-
 Reunion
-
 Romania
-
 Rwanda
-
 Saudi Arabia
-
 Serbia
-
 Singapore
-
 Slovakia
-
 Slovenia
-
 Somalia
-
 South Africa
-
 Spain
Spain
-
 Sri Lanka
-
 Sweden
-
 Switzerland
-
 Syria
Syria
-
 Taiwan
-
 Tajikistan
-
 Tanzania
-
 Thailand
-
 Trinidad and Tobago
-
 Tunisia
-
 Turkey
-
 UAE
UAE
-
 Uganda
-
 Ukraine
-
 United Kingdom
-
United States
-
 Uruguay
-
 Uzbekistan
-
 Venezuela
-
 Vietnam
-
 Yemen
Yemen
-
 Zambia
-
 Zimbabwe
- Forex
- Crypto
