
Pendle price prediction: Will sPENDLE boost sustain rally? PENDLE gains 7.89%

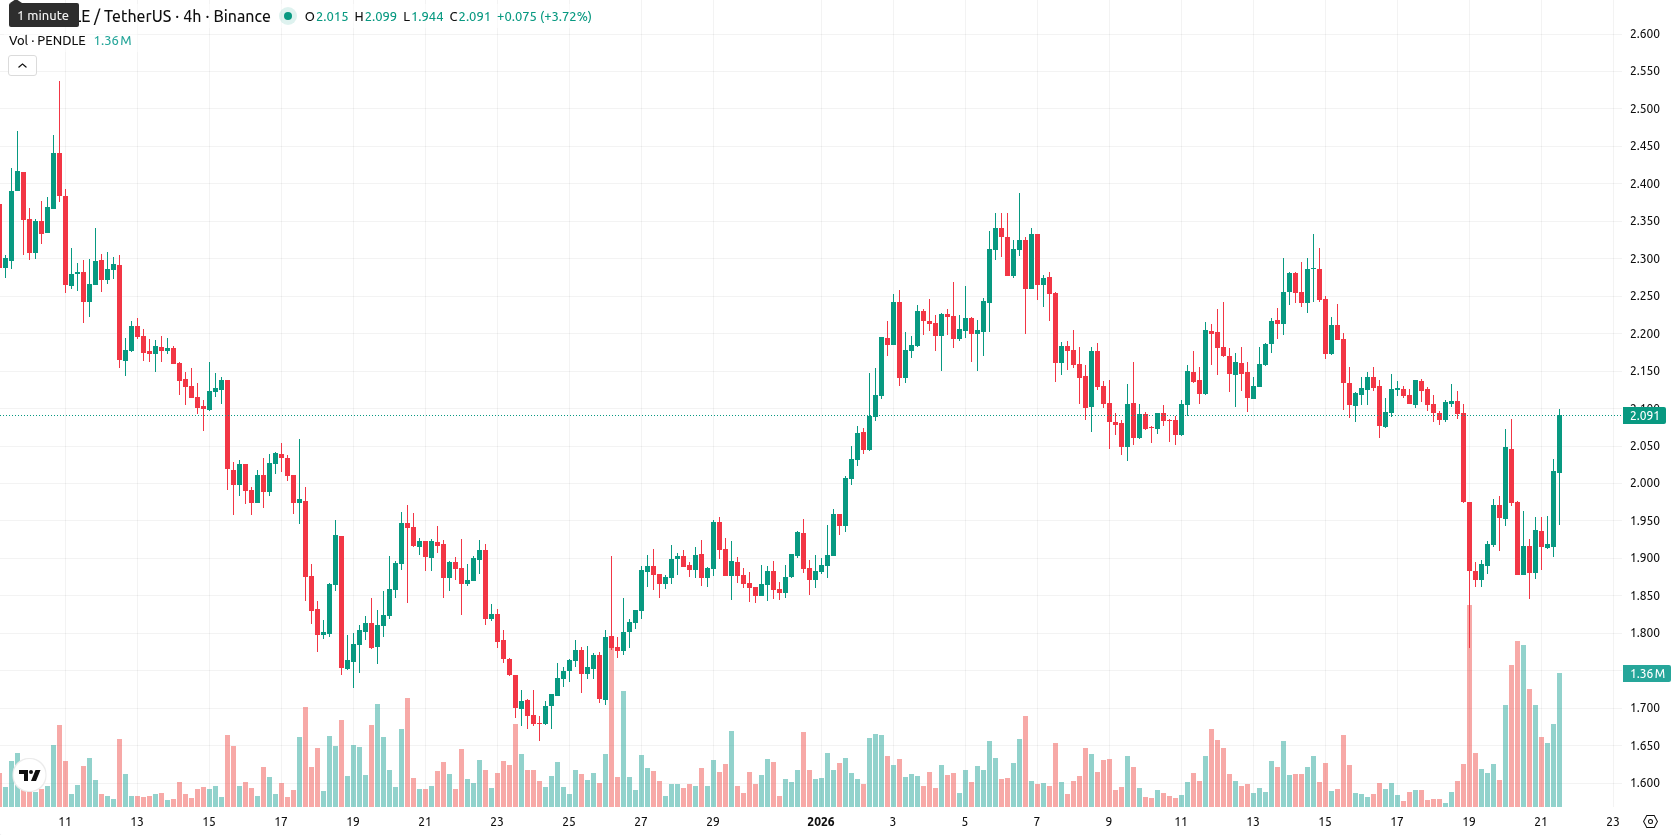
Pendle (PENDLE) is trading at $2.065, showing a modest daily movement. The asset remains below both the MA-20 ($2.1386) and MA-50 ($2.1075), and is well under the MA-200 ($3.5758), indicating sustained short- and medium-term downside pressure as well as a weakened longer-term technical structure.
Highlights
- Pendle has replaced its vePENDLE lock-up system with a new liquid staking governance token called sPENDLE, allowing tokens to remain transferable and reducing participation barriers.
- Up to 80% of protocol revenue will be allocated for buybacks of PENDLE tokens, with rewards redirected to sPENDLE holders and overall emissions dropping by about 30%.
- Existing vePENDLE holders receive a temporary reward multiplier based on their remaining lock-up period as part of the transition to the new framework.
Governance overhaul and buybacks shift rewards as emissions decline
Pendle has introduced a major tokenomics update, replacing its former vePENDLE lock-up system with a new liquid staking governance token named sPENDLE. The revised framework enables tokens to remain transferable and introduces a 14-day withdrawal period, improving capital efficiency and reducing participation barriers. Up to 80% of protocol revenue will be dedicated to buybacks for PENDLE tokens, with rewards rerouted to sPENDLE holders, and overall emissions are set to fall by roughly 30%. Existing vePENDLE holders are granted a temporary reward multiplier based on their remaining lock-up period.
Oversold indicators contrast with volatility and neutral momentum signals
Momentum signals for PENDLE are mixed on the daily chart. The MACD reading is neutral, with a weak ADX trend, while both the RSI (40.17) and CCI (–149.7) indicate ongoing oversold conditions. Stochastic RSI also points to a strongly oversold state, opening the possibility of a technical rebound, although the Bull/Bear Power indicator favors buyers intraday. The Awesome Oscillator remains neutral. Current price action reflects notable intraday volatility, with a push toward the top of today’s range contrasting against a backdrop of bearish daily momentum indicators.
Limited upside expected as oversold signals and weak trends persist
In the next five trading days, PENDLE is expected to consolidate within a volatility band from $1.90 to $2.25, reflecting recent trading dynamics. The likelihood of an upward move is low (below 20%), which makes further downside or sideways movement more probable as oversold signals and weak trend strength limit conviction. A break above MA-50 and $2.10 could open room for a short-term recovery toward $2.25, while a loss of support near the Ichimoku Kijun or $1.90 risks renewed selling toward lower weekly levels.
Previously it was reported that Pendle is exhibiting short-term bullish momentum above its 20-day average but faces resistance at the 50-day moving average and remains under long-term downward pressure beneath the 200-day average. Momentum and volatility are high with several overbought signals, while mixed oscillators and tightening support/resistance suggest a higher probability of near-term consolidation or pullback rather than a sustained upside move.


-
 Afghanistan
-
 Albania
-
 Algeria
-
 Angola
-
 Argentina
-
 Armenia
-
 Australia
-
 Austria
-
 Azerbaijan
-
 Bahamas
-
 Bahrain
-
 Bangladesh
-
 Belarus
-
 Belgium
-
 Bolivia
-
 Botswana
-
 Brazil
-
 Brunei
-
 Bulgaria
-
 Cambodia
-
 Cameroon
-
 Canada
-
 Chile
Chile
-
 China
China
-
 Colombia
-
 Congo
Congo
-
 Costa Rica
-
 Cote d'Ivoire
-
 Croatia
-
 Cuba
Cuba
-
 Cyprus
-
 Czechia
-
 DR Congo
-
 Denmark
-
 Dominican Republic
-
 Ecuador
-
 Egypt
Egypt
-
 El Salvador
-
 Estonia
-
 Eswatini
-
 Ethiopia
-
 Finland
-
 France
-
 Georgia
-
 Germany
-
 Ghana
Ghana
-
 Greece
-
 Haiti
Haiti
-
 Hong Kong
-
 Hungary
-
 India
India
-
 Indonesia
-
 Iran, Islamic republic
-
 Iraq
Iraq
-
 Ireland
-
 Israel
-
 Italy
Italy
-
 Jamaica
-
 Japan
Japan
-
 Jordan
-
 Kazakhstan
-
 Kenya
Kenya
-
 Korea
Korea
-
 Kuwait
-
 Kyrgyzstan
-
 Laos
Laos
-
 Latvia
-
 Lebanon
-
 Lesotho
-
 Libya
Libya
-
 Lithuania
-
 Luxembourg
-
 Madagascar
-
 Malaysia
-
 Malta
Malta
-
 Mauritius
-
 Mexico
-
 Moldova
-
 Mongolia
-
 Montenegro
-
 Morocco
-
 Mozambique
-
 Myanmar
-
 Namibia
-
 Nepal
Nepal
-
 Netherlands
-
 New Zealand
-
 Nigeria
-
 North Macedonia
-
 Norway
-
 Oman
Oman
-
 Pakistan
-
 Palestine
-
 Panama
-
 Papua New Guinea
-
 Paraguay
-
 Peru
Peru
-
 Philippines
-
 Poland
-
 Portugal
-
 Puerto Rico
-
 Qatar
Qatar
-
 Reunion
-
 Romania
-
 Rwanda
-
 Saudi Arabia
-
 Serbia
-
 Singapore
-
 Slovakia
-
 Slovenia
-
 Somalia
-
 South Africa
-
 Spain
Spain
-
 Sri Lanka
-
 Sweden
-
 Switzerland
-
 Syria
Syria
-
 Taiwan
-
 Tajikistan
-
 Tanzania
-
 Thailand
-
 Trinidad and Tobago
-
 Tunisia
-
 Turkey
-
 UAE
UAE
-
 Uganda
-
 Ukraine
-
 United Kingdom
-
United States
-
 Uruguay
-
 Uzbekistan
-
 Venezuela
-
 Vietnam
-
 Yemen
Yemen
-
 Zambia
-
 Zimbabwe
- Forex
- Crypto
