
TON weekly outlook: slides 7.62% as bearish momentum dominates below key resistance

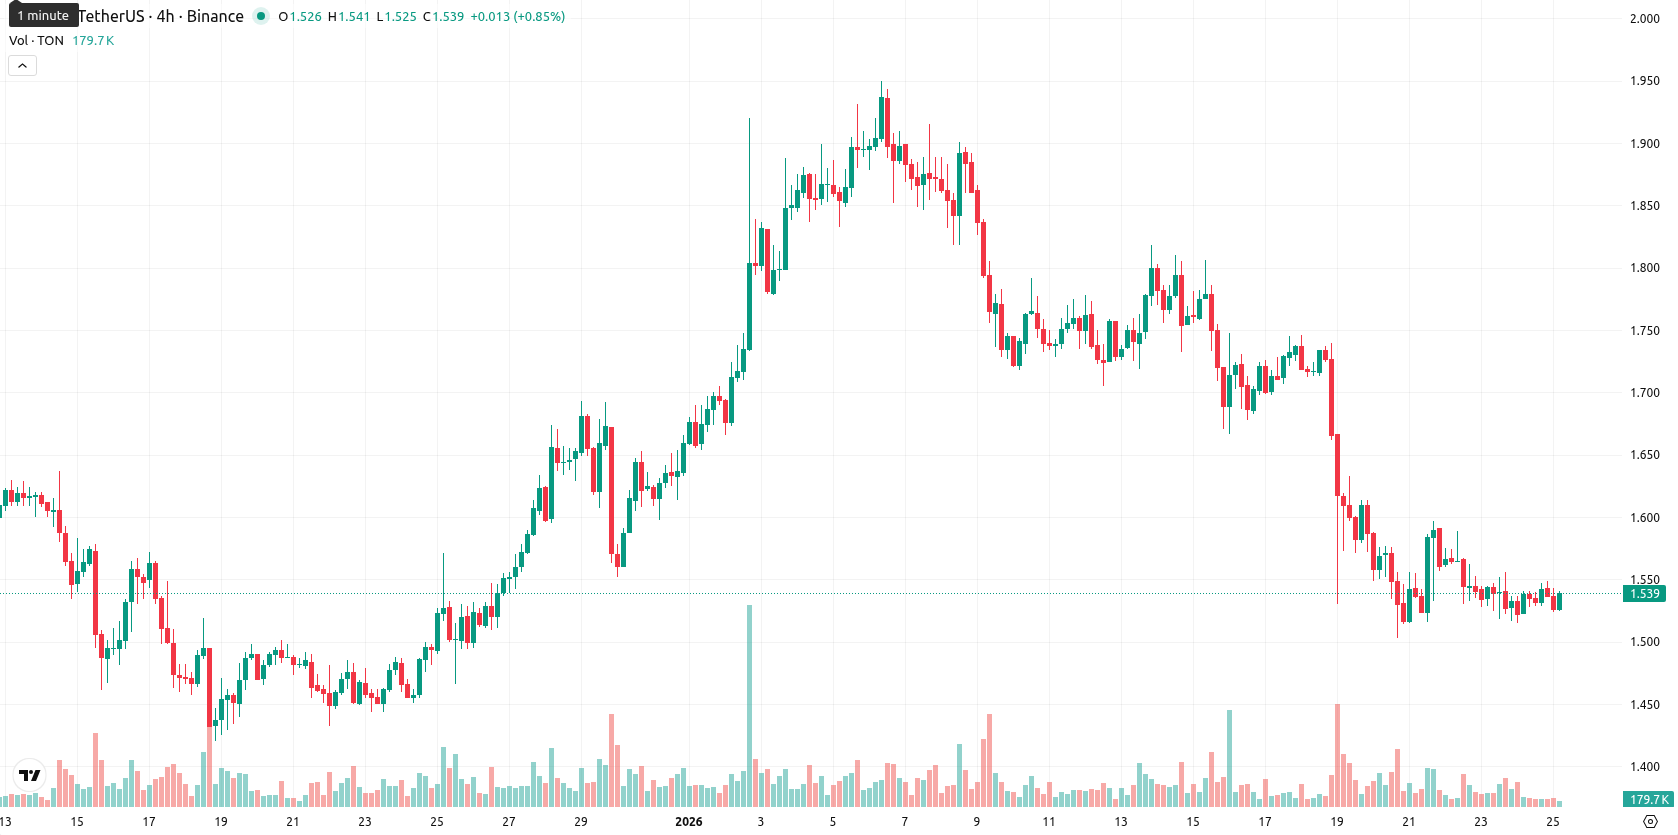
Toncoin (TON) is currently trading at $1.539, marking a weekly decline of 7.62%. The asset remains well below its weekly MA-20 at $2.043 and MA-50 at $2.750, as well as the Ichimoku Kijun at $2.149, highlighting sustained downside pressure and proximity to weekly lows.
Highlights
- TON is trading well below its weekly MA-20 (2.043) and MA-50 (2.750), underscoring sustained medium- and long-term downside risk.
- Weekly technical indicators—including MACD, ADX, RSI at 34.3, and oversold oscillators—confirm strong, persistent seller dominance and high downside momentum.
- Near-term projection expects TON to trade between 1.530 and 1.610, with probability of a bullish move above 1.610 rated below 20%.
Token unlock and tech developments shift sentiment as regulatory focus intensifies
Toncoin is undertaking a significant token unlock this week, releasing over $62 million worth of tokens, equivalent to about 1.5% of its circulating supply. This event could influence market liquidity and investor sentiment around the asset. Additional developments include the launch of AlphaTON's Claude Connector, which integrates Anthropic's AI with TON blockchain technology, and increased attention on regulatory changes affecting Telegram, a key platform for TON.
Bearish momentum deepens as oversold signals and resistance persist during week
Weekly technical indicators for TON continue to show strong bearish momentum. The price remains firmly below the weekly MA-20 ($2.043), MA-50 ($2.750), and Ichimoku Kijun ($2.149), indicating persistent downward trend and strong dynamic resistance near the Kijun line. The weekly RSI sits at 34.3 with both the Stoch RSI and CCI in oversold territory, reflecting protracted seller control. MACD and ADX further confirm the dominance of sellers, while the BBP's negative reading underscores bearish sentiment; meanwhile, the Awesome Oscillator remains neutral, providing little counterbalance to the prevailing trend. Weekly volatility has been high, with prices nearer recent lows and little sign of imminent recovery.
Range-bound volatility likely as sideways-to-bearish trend dominates next week
Over the next five to seven trading days, TON is expected to move between $1.530 and $1.610, reflecting ongoing volatility and a sideways-to-bearish outlook on the weekly chart. The probability of a price increase is very low, with continued selling likely to dominate. A move above $1.610 could open the way to test resistance near $1.623, but a break below $1.530 would likely prompt renewed declines, targeting lower weekly extremes.
Previously it was reported that Toncoin remains in a persistent downtrend, trading well below all key moving averages as sellers maintain dominance and oversold signals emerge across major technical indicators. Analysts note that the asset is likely to trade sideways within the $1.55 to $1.65 range, with moderate volatility and limited upside potential unless resistance near $1.65–$1.70 is decisively breached.


-
 Afghanistan
-
 Albania
-
 Algeria
-
 Angola
-
 Argentina
-
 Armenia
-
 Australia
-
 Austria
-
 Azerbaijan
-
 Bahamas
-
 Bahrain
-
 Bangladesh
-
 Belarus
-
 Belgium
-
 Bolivia
-
 Botswana
-
 Brazil
-
 Brunei
-
 Bulgaria
-
 Cambodia
-
 Cameroon
-
 Canada
-
 Chile
Chile
-
 China
China
-
 Colombia
-
 Congo
Congo
-
 Costa Rica
-
 Cote d'Ivoire
-
 Croatia
-
 Cuba
Cuba
-
 Cyprus
-
 Czechia
-
 DR Congo
-
 Denmark
-
 Dominican Republic
-
 Ecuador
-
 Egypt
Egypt
-
 El Salvador
-
 Estonia
-
 Eswatini
-
 Ethiopia
-
 Finland
-
 France
-
 Georgia
-
 Germany
-
 Ghana
Ghana
-
 Greece
-
 Haiti
Haiti
-
 Hong Kong
-
 Hungary
-
 India
India
-
 Indonesia
-
 Iran, Islamic republic
-
 Iraq
Iraq
-
 Ireland
-
 Israel
-
 Italy
Italy
-
 Jamaica
-
 Japan
Japan
-
 Jordan
-
 Kazakhstan
-
 Kenya
Kenya
-
 Korea
Korea
-
 Kuwait
-
 Kyrgyzstan
-
 Laos
Laos
-
 Latvia
-
 Lebanon
-
 Lesotho
-
 Libya
Libya
-
 Lithuania
-
 Luxembourg
-
 Madagascar
-
 Malaysia
-
 Malta
Malta
-
 Mauritius
-
 Mexico
-
 Moldova
-
 Mongolia
-
 Montenegro
-
 Morocco
-
 Mozambique
-
 Myanmar
-
 Namibia
-
 Nepal
Nepal
-
 Netherlands
-
 New Zealand
-
 Nigeria
-
 North Macedonia
-
 Norway
-
 Oman
Oman
-
 Pakistan
-
 Palestine
-
 Panama
-
 Papua New Guinea
-
 Paraguay
-
 Peru
Peru
-
 Philippines
-
 Poland
-
 Portugal
-
 Puerto Rico
-
 Qatar
Qatar
-
 Reunion
-
 Romania
-
 Rwanda
-
 Saudi Arabia
-
 Serbia
-
 Singapore
-
 Slovakia
-
 Slovenia
-
 Somalia
-
 South Africa
-
 Spain
Spain
-
 Sri Lanka
-
 Sweden
-
 Switzerland
-
 Syria
Syria
-
 Taiwan
-
 Tajikistan
-
 Tanzania
-
 Thailand
-
 Trinidad and Tobago
-
 Tunisia
-
 Turkey
-
 UAE
UAE
-
 Uganda
-
 Ukraine
-
 United Kingdom
-
United States
-
 Uruguay
-
 Uzbekistan
-
 Venezuela
-
 Vietnam
-
 Yemen
Yemen
-
 Zambia
-
 Zimbabwe
- Forex
- Crypto
