
-7.55% for Pepe — technicals confirm sellers remain in control

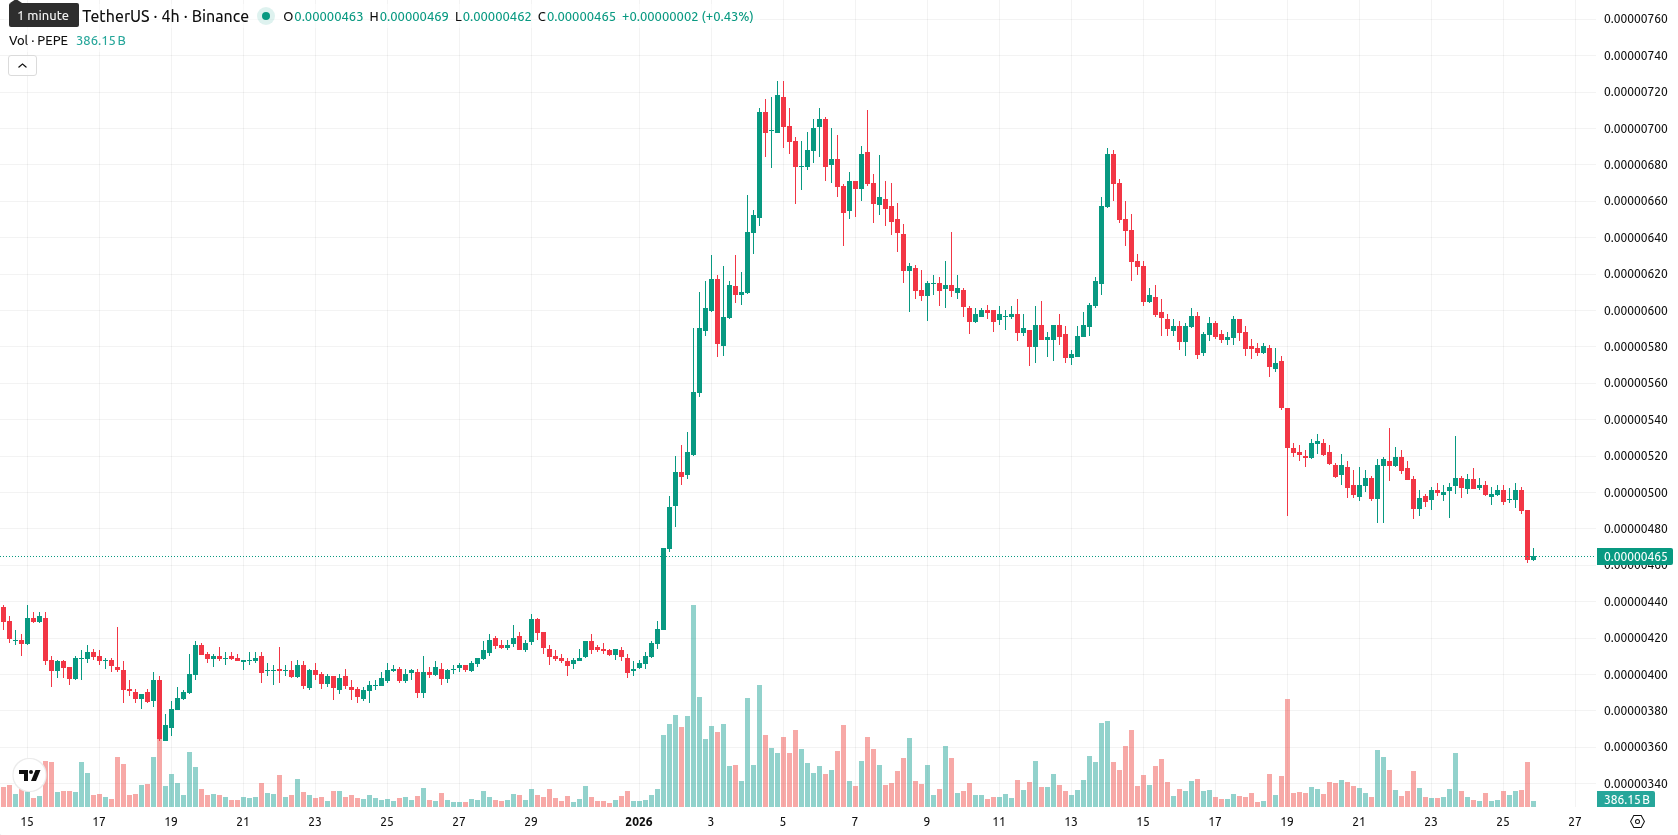
Pepe (PEPE) is trading at $0.0000047, sitting below its MA-20 ($0.00000581), just under the MA-50 ($0.00000499), and well beneath the MA-200 ($0.00000800). This alignment indicates that sellers maintain control across short, medium, and long-term timeframes, with resistance near the Ichimoku Kijun at $0.00000562 and immediate support at current price levels.
Highlights
- PEPE trades at $0.0000047, below the MA-20 ($0.00000581), MA-50 ($0.00000499), and MA-200 ($0.00000800), confirming dominant selling pressure across all timeframes.
- Momentum indicators (MACD, ADX) show weak bullish strength, while RSI and CCI highlight oversold conditions, suggesting sellers are potentially overstretched.
- Nearest resistance sits at $0.00000562 (Ichimoku Kijun), with support around $0.00000467; probability of a rise is below 20% over the next five days.
Volatile downtrend persists as momentum and oscillators signal selling exhaustion
Momentum remains weak for PEPE as both the MACD and ADX suggest a lack of bullish strength, while the RSI, Commodity Channel Index, and Stochastic RSI indicate oversold conditions that may signal selling exhaustion. Bull/Bear Power reinforces the dominance of sellers in intraday trading, confirming alignment between price action, momentum, and oscillator signals. The session has seen a highly volatile downtrend, sustained by selling pressure since the open.
Limited rebound odds as resistance caps near-term outlook
Over the next five trading days, PEPE is expected to trade within a volatility band from $0.00000467 to $0.00000498. The chance for a rebound is low — less than 20% — favoring continued downward or sideways movement beneath the key moving averages. A bullish reversal would require a break above resistance at $0.00000562, while a drop below $0.00000467 could trigger further losses as sellers press their advantage.
Previously it was reported that Pepe is trading below its short-term and long-term moving averages but above the medium-term MA, reflecting ongoing bearish momentum with medium-term support and resistance seen near the Ichimoku Kijun level. Despite a recent uptick in trading volume and occasional buy signals from the MACD, most momentum indicators—including RSI and CCI—highlight persistent selling pressure and oversold conditions, with the asset expected to consolidate within a narrow range unless a decisive move above resistance or below support occurs.


Latest PEPE/USD News


-
 Afghanistan
-
 Albania
-
 Algeria
-
 Angola
-
 Argentina
-
 Armenia
-
 Australia
-
 Austria
-
 Azerbaijan
-
 Bahamas
-
 Bahrain
-
 Bangladesh
-
 Belarus
-
 Belgium
-
 Bolivia
-
 Botswana
-
 Brazil
-
 Brunei
-
 Bulgaria
-
 Cambodia
-
 Cameroon
-
 Canada
-
 Chile
Chile
-
 China
China
-
 Colombia
-
 Congo
Congo
-
 Costa Rica
-
 Cote d'Ivoire
-
 Croatia
-
 Cuba
Cuba
-
 Cyprus
-
 Czechia
-
 DR Congo
-
 Denmark
-
 Dominican Republic
-
 Ecuador
-
 Egypt
Egypt
-
 El Salvador
-
 Estonia
-
 Eswatini
-
 Ethiopia
-
 Finland
-
 France
-
 Georgia
-
 Germany
-
 Ghana
Ghana
-
 Greece
-
 Haiti
Haiti
-
 Hong Kong
-
 Hungary
-
 India
India
-
 Indonesia
-
 Iran, Islamic republic
-
 Iraq
Iraq
-
 Ireland
-
 Israel
-
 Italy
Italy
-
 Jamaica
-
 Japan
Japan
-
 Jordan
-
 Kazakhstan
-
 Kenya
Kenya
-
 Korea
Korea
-
 Kuwait
-
 Kyrgyzstan
-
 Laos
Laos
-
 Latvia
-
 Lebanon
-
 Lesotho
-
 Libya
Libya
-
 Lithuania
-
 Luxembourg
-
 Madagascar
-
 Malaysia
-
 Malta
Malta
-
 Mauritius
-
 Mexico
-
 Moldova
-
 Mongolia
-
 Montenegro
-
 Morocco
-
 Mozambique
-
 Myanmar
-
 Namibia
-
 Nepal
Nepal
-
 Netherlands
-
 New Zealand
-
 Nigeria
-
 North Macedonia
-
 Norway
-
 Oman
Oman
-
 Pakistan
-
 Palestine
-
 Panama
-
 Papua New Guinea
-
 Paraguay
-
 Peru
Peru
-
 Philippines
-
 Poland
-
 Portugal
-
 Puerto Rico
-
 Qatar
Qatar
-
 Reunion
-
 Romania
-
 Rwanda
-
 Saudi Arabia
-
 Serbia
-
 Singapore
-
 Slovakia
-
 Slovenia
-
 Somalia
-
 South Africa
-
 Spain
Spain
-
 Sri Lanka
-
 Sweden
-
 Switzerland
-
 Syria
Syria
-
 Taiwan
-
 Tajikistan
-
 Tanzania
-
 Thailand
-
 Trinidad and Tobago
-
 Tunisia
-
 Turkey
-
 UAE
UAE
-
 Uganda
-
 Ukraine
-
 United Kingdom
-
United States
-
 Uruguay
-
 Uzbekistan
-
 Venezuela
-
 Vietnam
-
 Yemen
Yemen
-
 Zambia
-
 Zimbabwe
- Forex
- Crypto
