
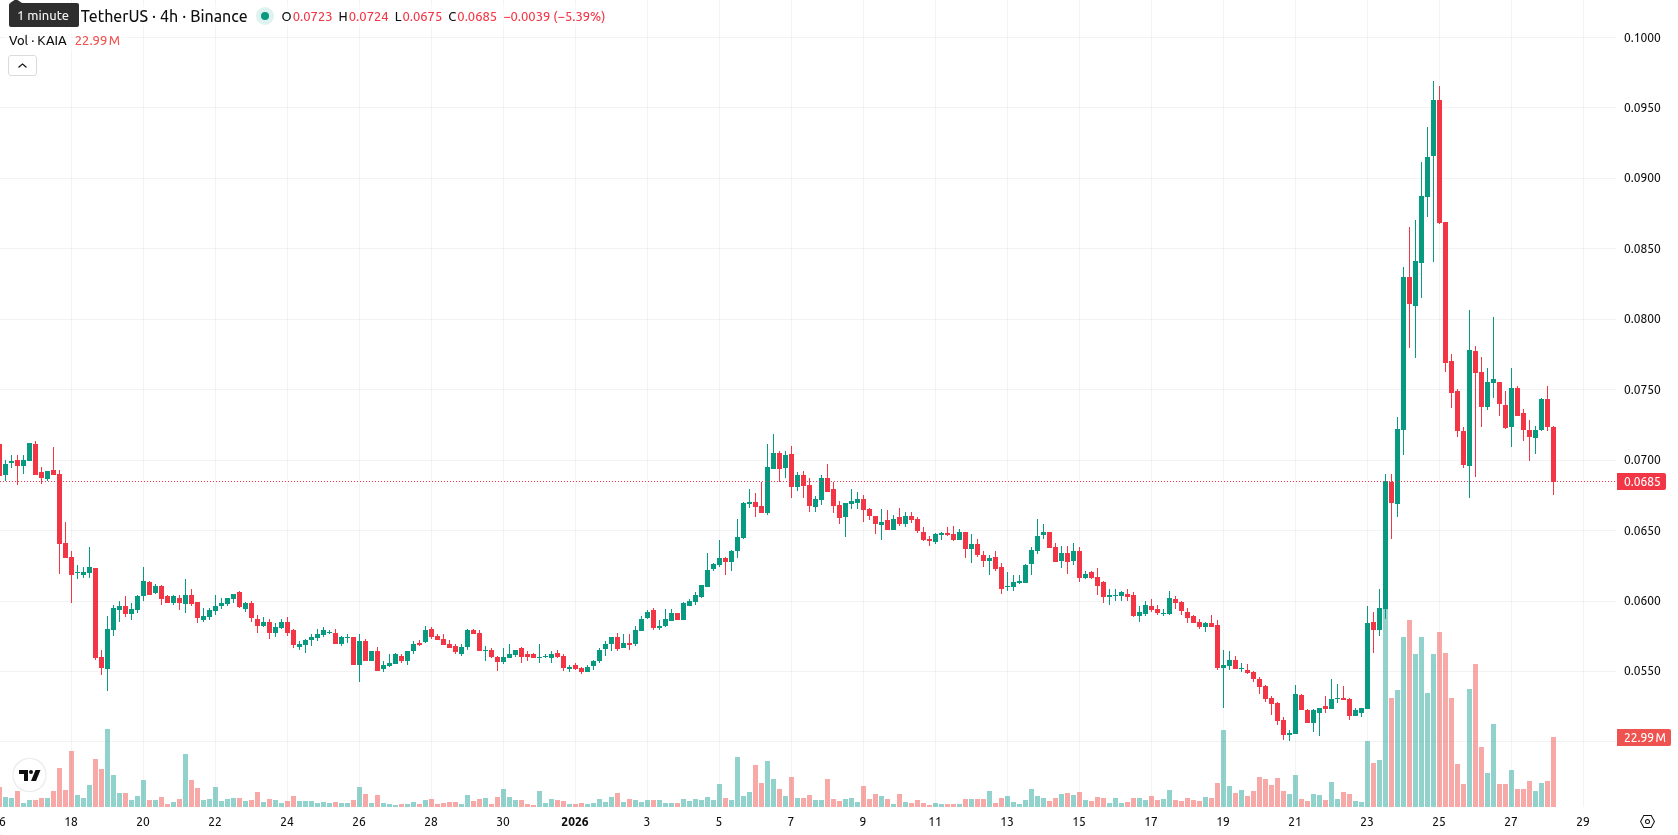
-7.55% for Kaia — rangebound trade likely after break below key levels

Kaia (KAIA) is trading at $0.0684, positioned above both the MA-20 ($0.0643) and MA-50 ($0.0639), yet remains well below the MA-200 ($0.1133). This places the asset in a short- and medium-term bullish setup, while the Ichimoku Kijun at $0.0735 acts as a key resistance level just overhead.
Highlights
- KAIA is trading at $0.0684, above MA-20 ($0.0643) and MA-50 ($0.0639), indicating short-term bullish momentum but well below MA-200 ($0.1133), signaling long-term resistance.
- Despite bullish signals from MACD and ADX, a sharp 7.55% intraday drop and close near session lows indicate heavy selling pressure and rising volatility.
- Key levels are support at $0.0660 and immediate resistance at $0.0735 (Ichimoku Kijun); probability of a price increase in the next five days is below 20%.
Volatility risk rises as momentum indicators diverge intraday
Momentum signals on the daily chart are mixed. The MACD and ADX highlight underlying bullish momentum, but the RSI and Commodity Channel Index remain in neutral-to-bullish zones, and the Stochastic RSI shows neither overbought nor oversold extremes. Marginally positive Bull/Bear Power indicates buyers maintain a slight intraday edge, supported by the Awesome Oscillator’s alignment with the bullish trend. However, a sharp daily drop of 7.55% off a small overnight gap, with the last trade near the session’s low, reveals significant volatility and heavy intraday selling — a short-term divergence that suggests growing caution despite generally supportive trend indicators.
Further downside likely as volatility band constrains upside potential
Kaia is expected to remain within a typical volatility band of $0.0660–$0.0720 over the next five trading days. The probability of a price increase is very low (under 20%), indicating a greater likelihood of further downside. In the baseline case, the price will likely move sideways between these support and resistance levels. A bullish shift would require a break above the Ichimoku Kijun at $0.0735, while a decline below $0.0660 could trigger additional losses if sellers stay in control.
Previously it was reported that Kaia remains above its short- and medium-term moving averages, reflecting positive momentum, while technical indicators such as MACD and ADX suggest an ongoing upward trend despite high volatility and mild overbought signals from the CCI. However, the asset faces resistance at the Ichimoku Kijun and MA-200, with neutral readings on RSI and subdued buyer interest, indicating potential for continued downside pressure.


-
 Afghanistan
-
 Albania
-
 Algeria
-
 Angola
-
 Argentina
-
 Armenia
-
 Australia
-
 Austria
-
 Azerbaijan
-
 Bahamas
-
 Bahrain
-
 Bangladesh
-
 Belarus
-
 Belgium
-
 Bolivia
-
 Botswana
-
 Brazil
-
 Brunei
-
 Bulgaria
-
 Cambodia
-
 Cameroon
-
 Canada
-
 Chile
Chile
-
 China
China
-
 Colombia
-
 Congo
Congo
-
 Costa Rica
-
 Cote d'Ivoire
-
 Croatia
-
 Cuba
Cuba
-
 Cyprus
-
 Czechia
-
 DR Congo
-
 Denmark
-
 Dominican Republic
-
 Ecuador
-
 Egypt
Egypt
-
 El Salvador
-
 Estonia
-
 Eswatini
-
 Ethiopia
-
 Finland
-
 France
-
 Georgia
-
 Germany
-
 Ghana
Ghana
-
 Greece
-
 Haiti
Haiti
-
 Hong Kong
-
 Hungary
-
 India
India
-
 Indonesia
-
 Iran, Islamic republic
-
 Iraq
Iraq
-
 Ireland
-
 Israel
-
 Italy
Italy
-
 Jamaica
-
 Japan
Japan
-
 Jordan
-
 Kazakhstan
-
 Kenya
Kenya
-
 Korea
Korea
-
 Kuwait
-
 Kyrgyzstan
-
 Laos
Laos
-
 Latvia
-
 Lebanon
-
 Lesotho
-
 Libya
Libya
-
 Lithuania
-
 Luxembourg
-
 Madagascar
-
 Malaysia
-
 Malta
Malta
-
 Mauritius
-
 Mexico
-
 Moldova
-
 Mongolia
-
 Montenegro
-
 Morocco
-
 Mozambique
-
 Myanmar
-
 Namibia
-
 Nepal
Nepal
-
 Netherlands
-
 New Zealand
-
 Nigeria
-
 North Macedonia
-
 Norway
-
 Oman
Oman
-
 Pakistan
-
 Palestine
-
 Panama
-
 Papua New Guinea
-
 Paraguay
-
 Peru
Peru
-
 Philippines
-
 Poland
-
 Portugal
-
 Puerto Rico
-
 Qatar
Qatar
-
 Reunion
-
 Romania
-
 Rwanda
-
 Saudi Arabia
-
 Serbia
-
 Singapore
-
 Slovakia
-
 Slovenia
-
 Somalia
-
 South Africa
-
 Spain
Spain
-
 Sri Lanka
-
 Sweden
-
 Switzerland
-
 Syria
Syria
-
 Taiwan
-
 Tajikistan
-
 Tanzania
-
 Thailand
-
 Trinidad and Tobago
-
 Tunisia
-
 Turkey
-
 UAE
UAE
-
 Uganda
-
 Ukraine
-
 United Kingdom
-
United States
-
 Uruguay
-
 Uzbekistan
-
 Venezuela
-
 Vietnam
-
 Yemen
Yemen
-
 Zambia
-
 Zimbabwe
- Forex
- Crypto
