
The Graph falls sharply as sellers dominate amid weak momentum signals

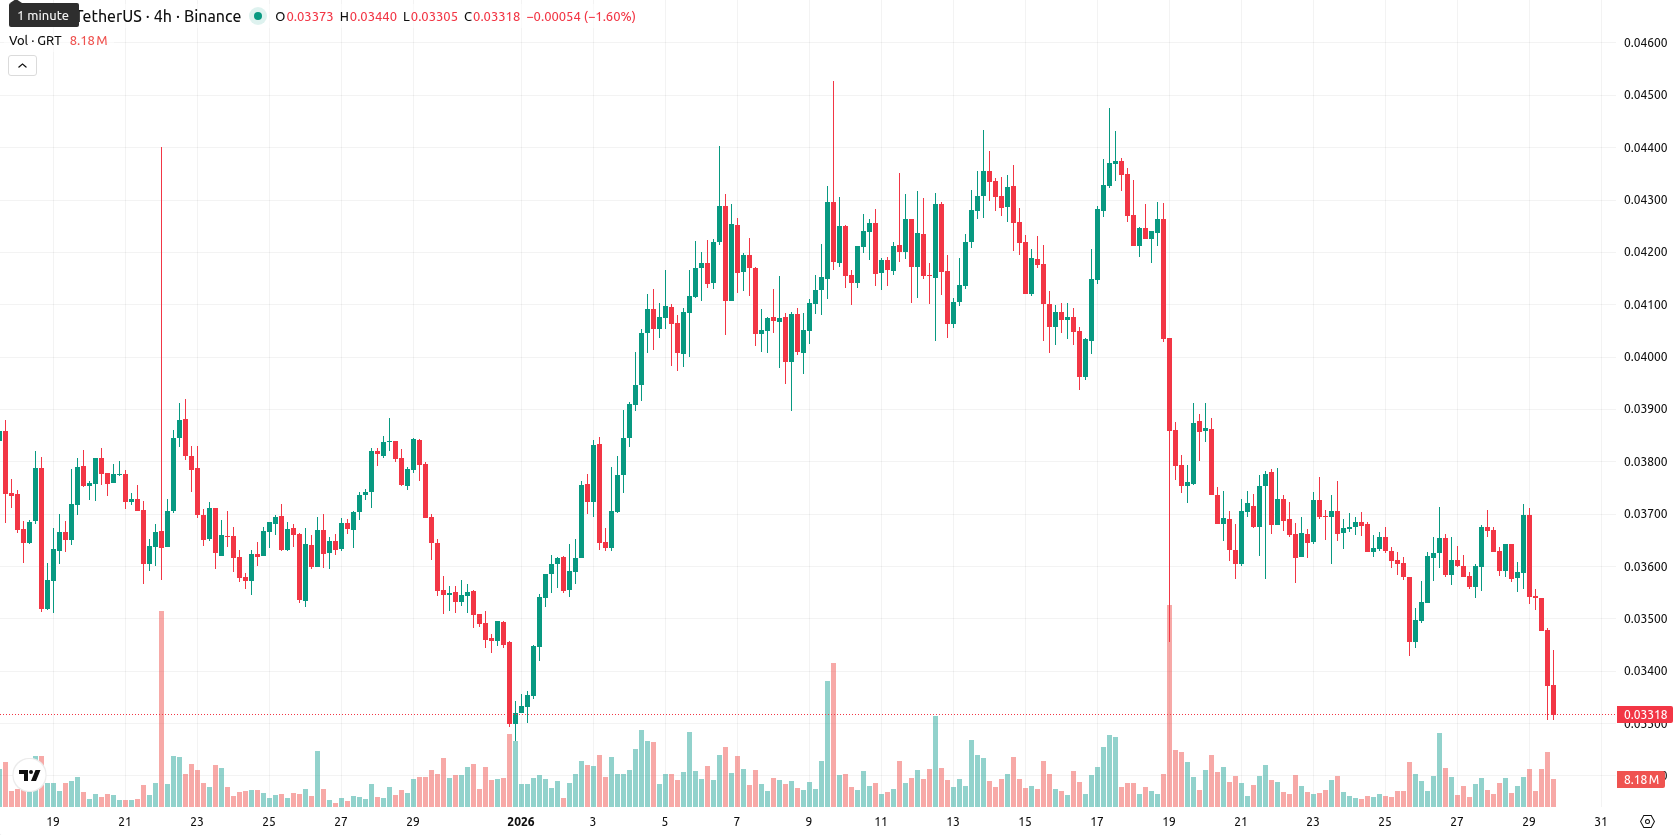
The Graph (GRT) is trading at $0.03311, registering a 7.49% decline from yesterday's close and moving near the day's low of $0.03306. GRT sits well below its MA-20 ($0.03918), MA-50 ($0.03878), and MA-200 ($0.06915), underscoring persistent selling pressure across all key timeframes.
Highlights
- GRT is trading at $0.03311, below the MA-20 ($0.03918), MA-50 ($0.03878), and MA-200 ($0.06915), confirming ongoing bearish pressure across all timeframes.
- Momentum indicators—including MACD, ADX, RSI, CCI, and Bull/Bear Power—all signal continued downside, with technical consensus supporting further near-term weakness after a 7.49% daily drop.
- Key technical levels are the Ichimoku Kijun resistance at $0.03978 and support at $0.033; a break below $0.033 may trigger retests near $0.030.
Persistent bearish signals as weak momentum meets resistance limits
Momentum signals on the daily chart remain weak, with MACD in sell territory and ADX at a subdued level, suggesting that the current downward trend lacks strong conviction. RSI and Commodity Channel Index are both flagging sell signals, while Stochastic RSI is neutral on the daily but indicates oversold across intraday timeframes, implying possible exhaustion in selling pressure. Bull/Bear Power remains in negative territory, confirming intraday dominance by sellers. The Awesome Oscillator also aligns with this bearish tone. The closest dynamic resistance is the Ichimoku Kijun level at $0.03978, and the ongoing inability to retake higher moving averages confirms the bearish market structure.
Downside risk elevated with limited recovery prospects ahead
Over the next five sessions, the typical volatility band is expected between $0.030 and $0.036. The probability of a sustained price increase is under 20%, while further downside remains more likely. Sideways movement near recent lows could emerge if selling pressure pauses, but regaining momentum above $0.036 and the Ichimoku Kijun level is needed for a bullish scenario. A drop below $0.033 would open the risk of retests toward $0.030, as technicals continue to favor downside risk in the short-term view.
Previously it was reported that The Graph remains under persistent selling pressure, trading below all major weekly moving averages with key technical indicators such as RSI, MACD, and ADX confirming continued bearish momentum. Immediate resistance is noted near the Ichimoku Kijun, while weak support and the absence of reversal signals suggest elevated downside risk and a likely continuation of the bearish trend.


-
 Afghanistan
-
 Albania
-
 Algeria
-
 Angola
-
 Argentina
-
 Armenia
-
 Australia
-
 Austria
-
 Azerbaijan
-
 Bahamas
-
 Bahrain
-
 Bangladesh
-
 Belarus
-
 Belgium
-
 Bolivia
-
 Botswana
-
 Brazil
-
 Brunei
-
 Bulgaria
-
 Cambodia
-
 Cameroon
-
 Canada
-
 Chile
Chile
-
 China
China
-
 Colombia
-
 Congo
Congo
-
 Costa Rica
-
 Cote d'Ivoire
-
 Croatia
-
 Cuba
Cuba
-
 Cyprus
-
 Czechia
-
 DR Congo
-
 Denmark
-
 Dominican Republic
-
 Ecuador
-
 Egypt
Egypt
-
 El Salvador
-
 Estonia
-
 Eswatini
-
 Ethiopia
-
 Finland
-
 France
-
 Georgia
-
 Germany
-
 Ghana
Ghana
-
 Greece
-
 Haiti
Haiti
-
 Hong Kong
-
 Hungary
-
 India
India
-
 Indonesia
-
 Iran, Islamic republic
-
 Iraq
Iraq
-
 Ireland
-
 Israel
-
 Italy
Italy
-
 Jamaica
-
 Japan
Japan
-
 Jordan
-
 Kazakhstan
-
 Kenya
Kenya
-
 Korea
Korea
-
 Kuwait
-
 Kyrgyzstan
-
 Laos
Laos
-
 Latvia
-
 Lebanon
-
 Lesotho
-
 Libya
Libya
-
 Lithuania
-
 Luxembourg
-
 Madagascar
-
 Malaysia
-
 Malta
Malta
-
 Mauritius
-
 Mexico
-
 Moldova
-
 Mongolia
-
 Montenegro
-
 Morocco
-
 Mozambique
-
 Myanmar
-
 Namibia
-
 Nepal
Nepal
-
 Netherlands
-
 New Zealand
-
 Nigeria
-
 North Macedonia
-
 Norway
-
 Oman
Oman
-
 Pakistan
-
 Palestine
-
 Panama
-
 Papua New Guinea
-
 Paraguay
-
 Peru
Peru
-
 Philippines
-
 Poland
-
 Portugal
-
 Puerto Rico
-
 Qatar
Qatar
-
 Reunion
-
 Romania
-
 Rwanda
-
 Saudi Arabia
-
 Serbia
-
 Singapore
-
 Slovakia
-
 Slovenia
-
 Somalia
-
 South Africa
-
 Spain
Spain
-
 Sri Lanka
-
 Sweden
-
 Switzerland
-
 Syria
Syria
-
 Taiwan
-
 Tajikistan
-
 Tanzania
-
 Thailand
-
 Trinidad and Tobago
-
 Tunisia
-
 Turkey
-
 UAE
UAE
-
 Uganda
-
 Ukraine
-
 United Kingdom
-
United States
-
 Uruguay
-
 Uzbekistan
-
 Venezuela
-
 Vietnam
-
 Yemen
Yemen
-
 Zambia
-
 Zimbabwe
- Forex
- Crypto
