
Jupiter: Mixed indicators support 7.40% daily gain despite bearish backdrop

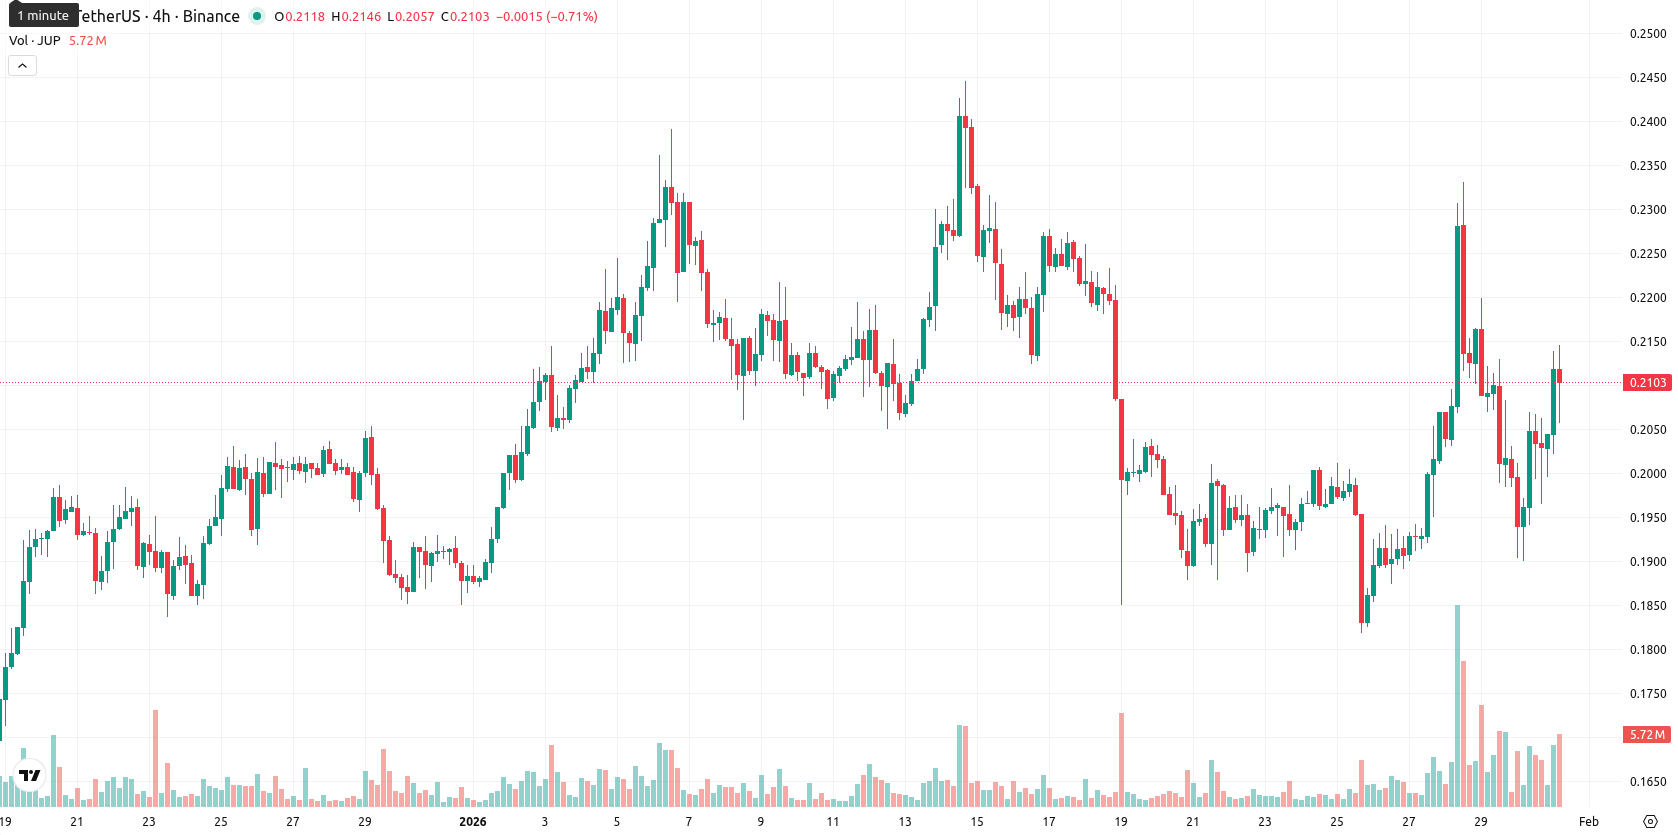
Jupiter (JUP) is trading at $0.2091, climbing 7.40% on the day. The price sits above both its MA-20 ($0.2064) and MA-50 ($0.2028), but is still well below the MA-200 ($0.3694), highlighting ongoing short- and medium-term strength amid a prolonged bearish long-term trend.
Highlights
- JUP trades at $0.2091, above its MA-20 ($0.2064) and MA-50 ($0.2028) but well below the MA-200 ($0.3694), signaling only short- and medium-term strength.
- Momentum signals are mixed: daily MACD is strongly bearish, ADX is neutral, while Stochastic RSI and BBP indicate active buyer dominance and a 'Buy' bias.
- The projected trading range for the next week is $0.2080–$0.2268, with sub-20% probability of further price increase and higher likelihood of sideways or downward movement.
Mixed signals as bullish momentum faces dual resistance
JUP’s latest structure points to positive momentum in the short and medium term: the asset is above both the MA-20 and MA-50, finding support just above the MA-50. Key dynamic resistance is located at the Ichimoku Kijun ($0.2132), while the long-term MA-200 remains far above. Technical indicators present a mixed outlook. The daily MACD signals strong bearish momentum, and ADX shows a neutral trend. Oscillators diverge — RSI is bearish and CCI is neutral, but Stochastic RSI and Bull/Bear Power both indicate buyer dominance and an active “Buy” bias. After a small upward gap at the open, JUP now trades near the session high, reflecting robust intraday demand and volatility despite conflicting momentum signals.
Limited upside potential seen amid weak breakout odds
Looking ahead, the typical volatility band for JUP is projected in the $0.2080 – $0.2268 range over the coming week. The probability of further price appreciation is considered very low (less than 20%), favoring a sideways or downward move. A bullish scenario would require a confident breakout above $0.2132, targeting gains toward $0.2268. Should price lose support at $0.2080, sellers could regain control and push JUP toward lower levels in alignment with the broader weekly bearish tone.
Previously it was reported that Jupiter is trading below all major moving averages, with persistent selling momentum confirmed by bearish signals from the MACD and weak trend strength across both daily and weekly timeframes. Immediate support sits near $0.19 with the primary resistance at $0.2132, and technicals favor continued consolidation or further downside unless a clear breakout occurs.


Latest Jupiter News


-
 Afghanistan
-
 Albania
-
 Algeria
-
 Angola
-
 Argentina
-
 Armenia
-
 Australia
-
 Austria
-
 Azerbaijan
-
 Bahamas
-
 Bahrain
-
 Bangladesh
-
 Belarus
-
 Belgium
-
 Bolivia
-
 Botswana
-
 Brazil
-
 Brunei
-
 Bulgaria
-
 Cambodia
-
 Cameroon
-
 Canada
-
 Chile
Chile
-
 China
China
-
 Colombia
-
 Congo
Congo
-
 Costa Rica
-
 Cote d'Ivoire
-
 Croatia
-
 Cuba
Cuba
-
 Cyprus
-
 Czechia
-
 DR Congo
-
 Denmark
-
 Dominican Republic
-
 Ecuador
-
 Egypt
Egypt
-
 El Salvador
-
 Estonia
-
 Eswatini
-
 Ethiopia
-
 Finland
-
 France
-
 Georgia
-
 Germany
-
 Ghana
Ghana
-
 Greece
-
 Haiti
Haiti
-
 Hong Kong
-
 Hungary
-
 India
India
-
 Indonesia
-
 Iran, Islamic republic
-
 Iraq
Iraq
-
 Ireland
-
 Israel
-
 Italy
Italy
-
 Jamaica
-
 Japan
Japan
-
 Jordan
-
 Kazakhstan
-
 Kenya
Kenya
-
 Korea
Korea
-
 Kuwait
-
 Kyrgyzstan
-
 Laos
Laos
-
 Latvia
-
 Lebanon
-
 Lesotho
-
 Libya
Libya
-
 Lithuania
-
 Luxembourg
-
 Madagascar
-
 Malaysia
-
 Malta
Malta
-
 Mauritius
-
 Mexico
-
 Moldova
-
 Mongolia
-
 Montenegro
-
 Morocco
-
 Mozambique
-
 Myanmar
-
 Namibia
-
 Nepal
Nepal
-
 Netherlands
-
 New Zealand
-
 Nigeria
-
 North Macedonia
-
 Norway
-
 Oman
Oman
-
 Pakistan
-
 Palestine
-
 Panama
-
 Papua New Guinea
-
 Paraguay
-
 Peru
Peru
-
 Philippines
-
 Poland
-
 Portugal
-
 Puerto Rico
-
 Qatar
Qatar
-
 Reunion
-
 Romania
-
 Rwanda
-
 Saudi Arabia
-
 Serbia
-
 Singapore
-
 Slovakia
-
 Slovenia
-
 Somalia
-
 South Africa
-
 Spain
Spain
-
 Sri Lanka
-
 Sweden
-
 Switzerland
-
 Syria
Syria
-
 Taiwan
-
 Tajikistan
-
 Tanzania
-
 Thailand
-
 Trinidad and Tobago
-
 Tunisia
-
 Turkey
-
 UAE
UAE
-
 Uganda
-
 Ukraine
-
 United Kingdom
-
United States
-
 Uruguay
-
 Uzbekistan
-
 Venezuela
-
 Vietnam
-
 Yemen
Yemen
-
 Zambia
-
 Zimbabwe
- Forex
- Crypto
