
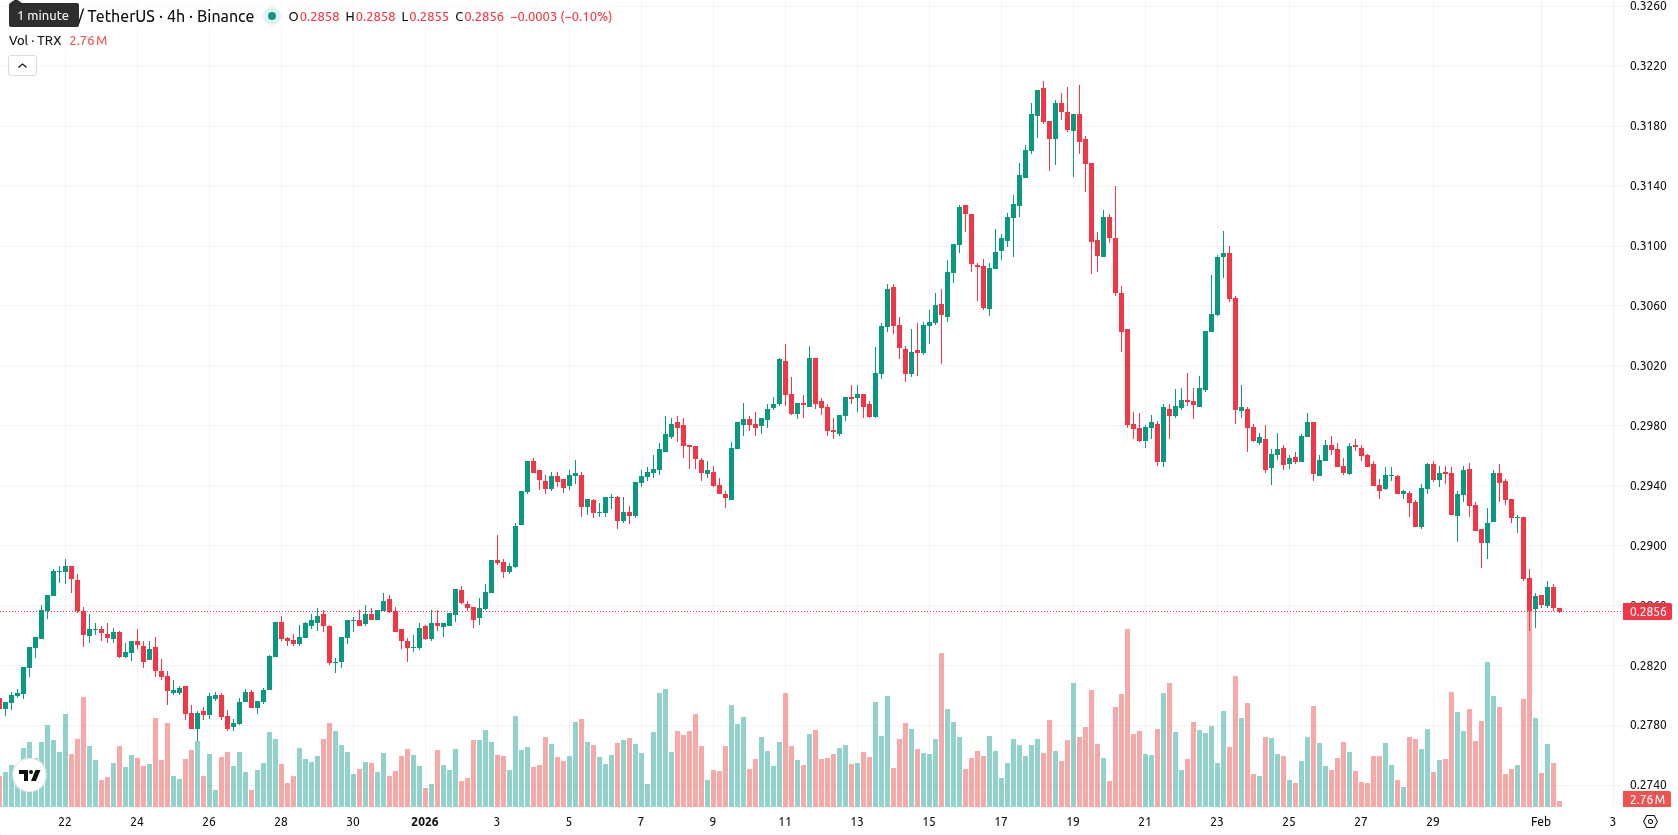
TRX weekly outlook: slips 3.45% as bearish momentum holds below major moving averages

Tron (TRX) is currently trading at $0.2856, recording a weekly decline in line with subdued broader sentiment. Over the last seven days, TRX has fallen in both absolute and percentage terms, settling below its W1 MA-20 at $0.3018, MA-50 at $0.2926, and MA-200 at $0.3124, confirming sustained bearish pressure and a position beneath key technical levels.
Highlights
- TRX/USD trades at $0.2856, below MA-20 ($0.3018), MA-50 ($0.2926), and MA-200 ($0.3124), reflecting sustained selling pressure across timeframes.
- Momentum indicators—MACD (neutral), ADX (16.24), RSI (38.44), and multiple oscillators in oversold—highlight weak trends and potential for short-term bearish exhaustion.
- Expected 5-day trading range is $0.2820–$0.2925; further downside is likely unless price reclaims above MA-50 ($0.2926) and Ichimoku Kijun ($0.3026).
Bearish momentum persists as indicators approach oversold territory
On the weekly chart, TRX remains weighed down by bearish momentum, trading below the MA-20, MA-50, and MA-200, with the nearest dynamic resistance set by the Ichimoku Kijun at $0.3026 and the MA-50 at $0.2926. No major moving average support is present nearby. Weekly indicators reinforce this view, as the RSI stands at 38.44 (weak but approaching oversold), and the CCI and Stochastic RSI both signal oversold conditions, suggesting short-term bearish exhaustion. The ADX reading of 16.24 points to a lack of strong trending force, while Bear Power and the Awesome Oscillator both indicate prevailing downside bias.
Tight range expected as low volatility limits bullish reversal odds
Looking ahead to the next 5–7 trading days, TRX is expected to move within a narrow range of $0.2820–$0.2925, reflecting recent low volatility and waning seller momentum. As weekly indicators align to a predominantly bearish outlook with only a small probability (less than 20%) of an upward reversal, further downside or continued consolidation is likely. For any bullish scenario to develop, the price would need to convincingly reclaim both the MA-50 and Ichimoku Kijun, with targets in the $0.2925–$0.2950 area. In the bearish case, a decline through $0.2820 could trigger a fresh wave lower, although deeply oversold oscillators suggest that a technical bounce is also possible in the near term.
Tron remains narrowly rangebound just above its 50-day moving average, with the price modestly lower after recent profit-taking despite heightened attention from its Coincheck Japan listing. Momentum indicators signal oversold conditions while MACD remains neutral, suggesting continued consolidation between support near $0.2917 and resistance at $0.3044 in the short term.


-
 Afghanistan
-
 Albania
-
 Algeria
-
 Angola
-
 Argentina
-
 Armenia
-
 Australia
-
 Austria
-
 Azerbaijan
-
 Bahamas
-
 Bahrain
-
 Bangladesh
-
 Belarus
-
 Belgium
-
 Bolivia
-
 Botswana
-
 Brazil
-
 Brunei
-
 Bulgaria
-
 Cambodia
-
 Cameroon
-
 Canada
-
 Chile
Chile
-
 China
China
-
 Colombia
-
 Congo
Congo
-
 Costa Rica
-
 Cote d'Ivoire
-
 Croatia
-
 Cuba
Cuba
-
 Cyprus
-
 Czechia
-
 DR Congo
-
 Denmark
-
 Dominican Republic
-
 Ecuador
-
 Egypt
Egypt
-
 El Salvador
-
 Estonia
-
 Eswatini
-
 Ethiopia
-
 Finland
-
 France
-
 Georgia
-
 Germany
-
 Ghana
Ghana
-
 Greece
-
 Haiti
Haiti
-
 Hong Kong
-
 Hungary
-
 India
India
-
 Indonesia
-
 Iran, Islamic republic
-
 Iraq
Iraq
-
 Ireland
-
 Israel
-
 Italy
Italy
-
 Jamaica
-
 Japan
Japan
-
 Jordan
-
 Kazakhstan
-
 Kenya
Kenya
-
 Korea
Korea
-
 Kuwait
-
 Kyrgyzstan
-
 Laos
Laos
-
 Latvia
-
 Lebanon
-
 Lesotho
-
 Libya
Libya
-
 Lithuania
-
 Luxembourg
-
 Madagascar
-
 Malaysia
-
 Malta
Malta
-
 Mauritius
-
 Mexico
-
 Moldova
-
 Mongolia
-
 Montenegro
-
 Morocco
-
 Mozambique
-
 Myanmar
-
 Namibia
-
 Nepal
Nepal
-
 Netherlands
-
 New Zealand
-
 Nigeria
-
 North Macedonia
-
 Norway
-
 Oman
Oman
-
 Pakistan
-
 Palestine
-
 Panama
-
 Papua New Guinea
-
 Paraguay
-
 Peru
Peru
-
 Philippines
-
 Poland
-
 Portugal
-
 Puerto Rico
-
 Qatar
Qatar
-
 Reunion
-
 Romania
-
 Rwanda
-
 Saudi Arabia
-
 Serbia
-
 Singapore
-
 Slovakia
-
 Slovenia
-
 Somalia
-
 South Africa
-
 Spain
Spain
-
 Sri Lanka
-
 Sweden
-
 Switzerland
-
 Syria
Syria
-
 Taiwan
-
 Tajikistan
-
 Tanzania
-
 Thailand
-
 Trinidad and Tobago
-
 Tunisia
-
 Turkey
-
 UAE
UAE
-
 Uganda
-
 Ukraine
-
 United Kingdom
-
United States
-
 Uruguay
-
 Uzbekistan
-
 Venezuela
-
 Vietnam
-
 Yemen
Yemen
-
 Zambia
-
 Zimbabwe
- Forex
- Crypto
