
Pepe falls 7.18% as technical indicators highlight strong bearish momentum

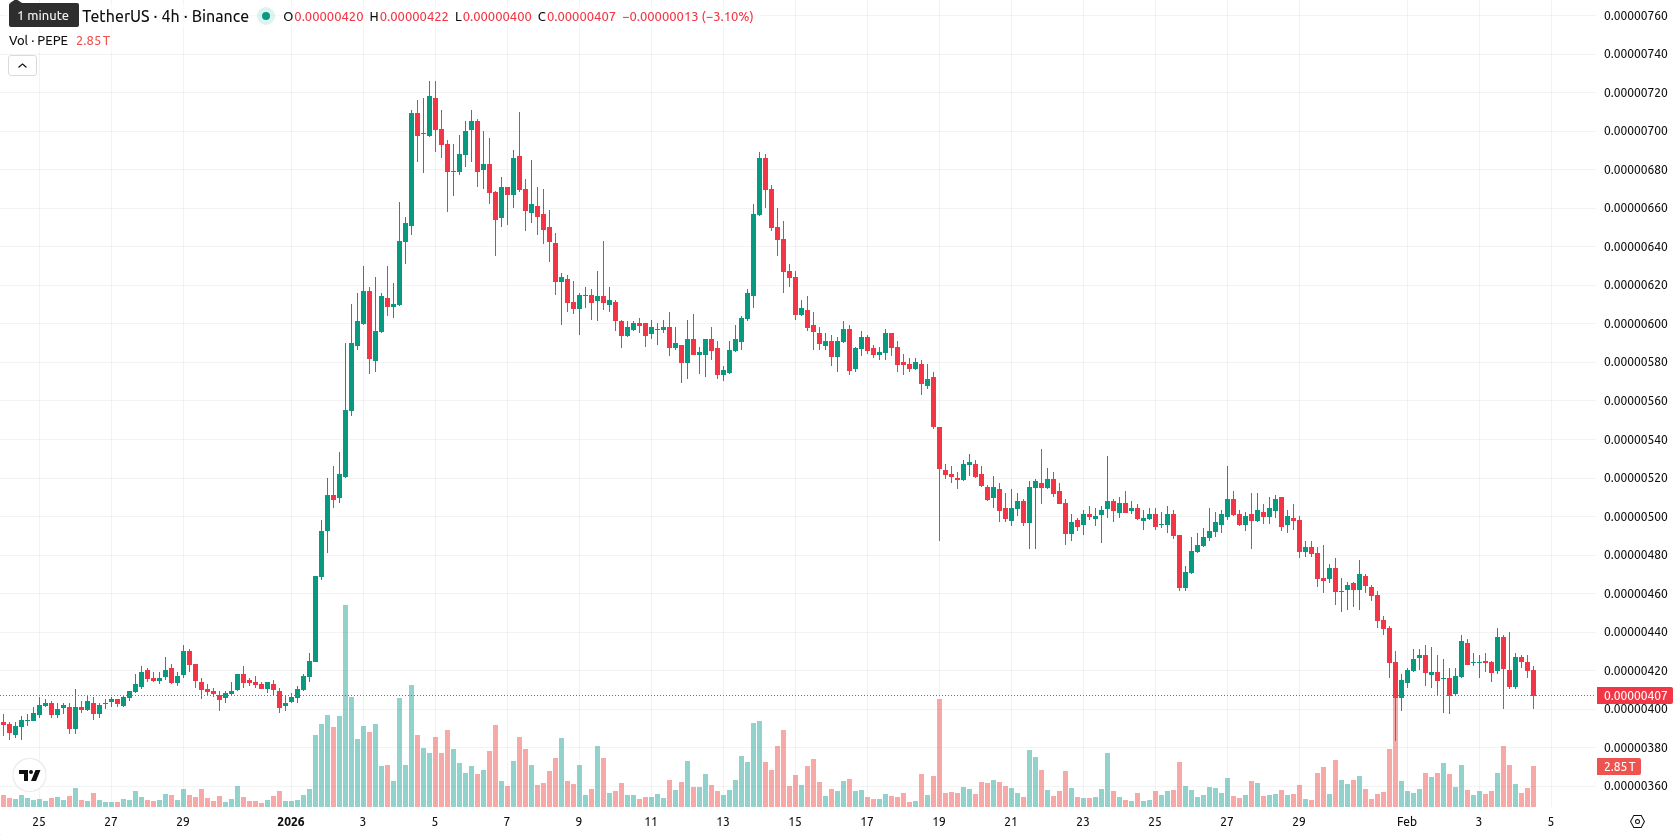
Pepe (PEPE) is trading at $0.0000040, below the MA-20 ($0.00000497), MA-50 ($0.00000501), and MA-200 ($0.00000760), reflecting strong downtrends across all major timeframes. Persistent seller pressure keeps the asset firmly below key moving averages, signaling sustained weakness compared to recent periods.
Highlights
- PEPE trades at $0.0000040, below its MA-20, MA-50, and MA-200, confirming strong downtrends across all timeframes and persistent seller pressure.
- Momentum remains decisively negative, with daily MACD, ADX, RSI, and Stochastic RSI all pointing to oversold conditions and seller dominance intraday.
- The expected five-day price corridor is $0.00000385 (support) to $0.00000440 (resistance), with less than a 20% chance of upward movement.
Bearish momentum confirmed as resistance strengthens and oversold signals persist
The Ichimoku Kijun level at $0.00000536 establishes the nearest dynamic resistance, while there is little sign of a supportive base at current prices. Momentum indicators like MACD and ADX on the daily chart confirm the ongoing bearish trend and weak directional strength. Both RSI and CCI readings are in oversold territory, as is the Stochastic RSI, but Bull/Bear Power signals sellers continue to dominate intraday momentum. The Awesome Oscillator remains biased to the downside, reinforcing the prevailing selling pressure.
Sideways consolidation expected as breakout risks remain limited
In the short term, PEPE is likely to remain trapped within a typical volatility band between $0.00000385 and $0.00000440, centered near the current level. The probability of an upward breakout is low, with less than a 20% chance for a sustained price increase as signaled by weekly trend indicators. The most probable scenario is for sideways consolidation within this range, while a decisive move above $0.00000440 would point to potential recovery and a breakdown below $0.00000385 could open the way for further declines.
Previously it was reported that Pepe remains under bearish pressure, trading below all key weekly moving averages with technical indicators such as RSI, CCI, Stochastic RSI, and MACD confirming oversold conditions and prevailing downside momentum. Analysts expect continued sideways consolidation within a narrow range, with resistance at the Ichimoku Kijun and limited prospects for a bullish reversal in the near term.


Latest PEPE/USD News


-
 Afghanistan
-
 Albania
-
 Algeria
-
 Angola
-
 Argentina
-
 Armenia
-
 Australia
-
 Austria
-
 Azerbaijan
-
 Bahamas
-
 Bahrain
-
 Bangladesh
-
 Belarus
-
 Belgium
-
 Bolivia
-
 Botswana
-
 Brazil
-
 Brunei
-
 Bulgaria
-
 Cambodia
-
 Cameroon
-
 Canada
-
 Chile
Chile
-
 China
China
-
 Colombia
-
 Congo
Congo
-
 Costa Rica
-
 Cote d'Ivoire
-
 Croatia
-
 Cuba
Cuba
-
 Cyprus
-
 Czechia
-
 DR Congo
-
 Denmark
-
 Dominican Republic
-
 Ecuador
-
 Egypt
Egypt
-
 El Salvador
-
 Estonia
-
 Eswatini
-
 Ethiopia
-
 Finland
-
 France
-
 Georgia
-
 Germany
-
 Ghana
Ghana
-
 Greece
-
 Haiti
Haiti
-
 Hong Kong
-
 Hungary
-
 India
India
-
 Indonesia
-
 Iran, Islamic republic
-
 Iraq
Iraq
-
 Ireland
-
 Israel
-
 Italy
Italy
-
 Jamaica
-
 Japan
Japan
-
 Jordan
-
 Kazakhstan
-
 Kenya
Kenya
-
 Korea
Korea
-
 Kuwait
-
 Kyrgyzstan
-
 Laos
Laos
-
 Latvia
-
 Lebanon
-
 Lesotho
-
 Libya
Libya
-
 Lithuania
-
 Luxembourg
-
 Madagascar
-
 Malaysia
-
 Malta
Malta
-
 Mauritius
-
 Mexico
-
 Moldova
-
 Mongolia
-
 Montenegro
-
 Morocco
-
 Mozambique
-
 Myanmar
-
 Namibia
-
 Nepal
Nepal
-
 Netherlands
-
 New Zealand
-
 Nigeria
-
 North Macedonia
-
 Norway
-
 Oman
Oman
-
 Pakistan
-
 Palestine
-
 Panama
-
 Papua New Guinea
-
 Paraguay
-
 Peru
Peru
-
 Philippines
-
 Poland
-
 Portugal
-
 Puerto Rico
-
 Qatar
Qatar
-
 Reunion
-
 Romania
-
 Rwanda
-
 Saudi Arabia
-
 Serbia
-
 Singapore
-
 Slovakia
-
 Slovenia
-
 Somalia
-
 South Africa
-
 Spain
Spain
-
 Sri Lanka
-
 Sweden
-
 Switzerland
-
 Syria
Syria
-
 Taiwan
-
 Tajikistan
-
 Tanzania
-
 Thailand
-
 Trinidad and Tobago
-
 Tunisia
-
 Turkey
-
 UAE
UAE
-
 Uganda
-
 Ukraine
-
 United Kingdom
-
United States
-
 Uruguay
-
 Uzbekistan
-
 Venezuela
-
 Vietnam
-
 Yemen
Yemen
-
 Zambia
-
 Zimbabwe
- Forex
- Crypto
