
Polygon plunges after technical signals reinforce ongoing bearish trend

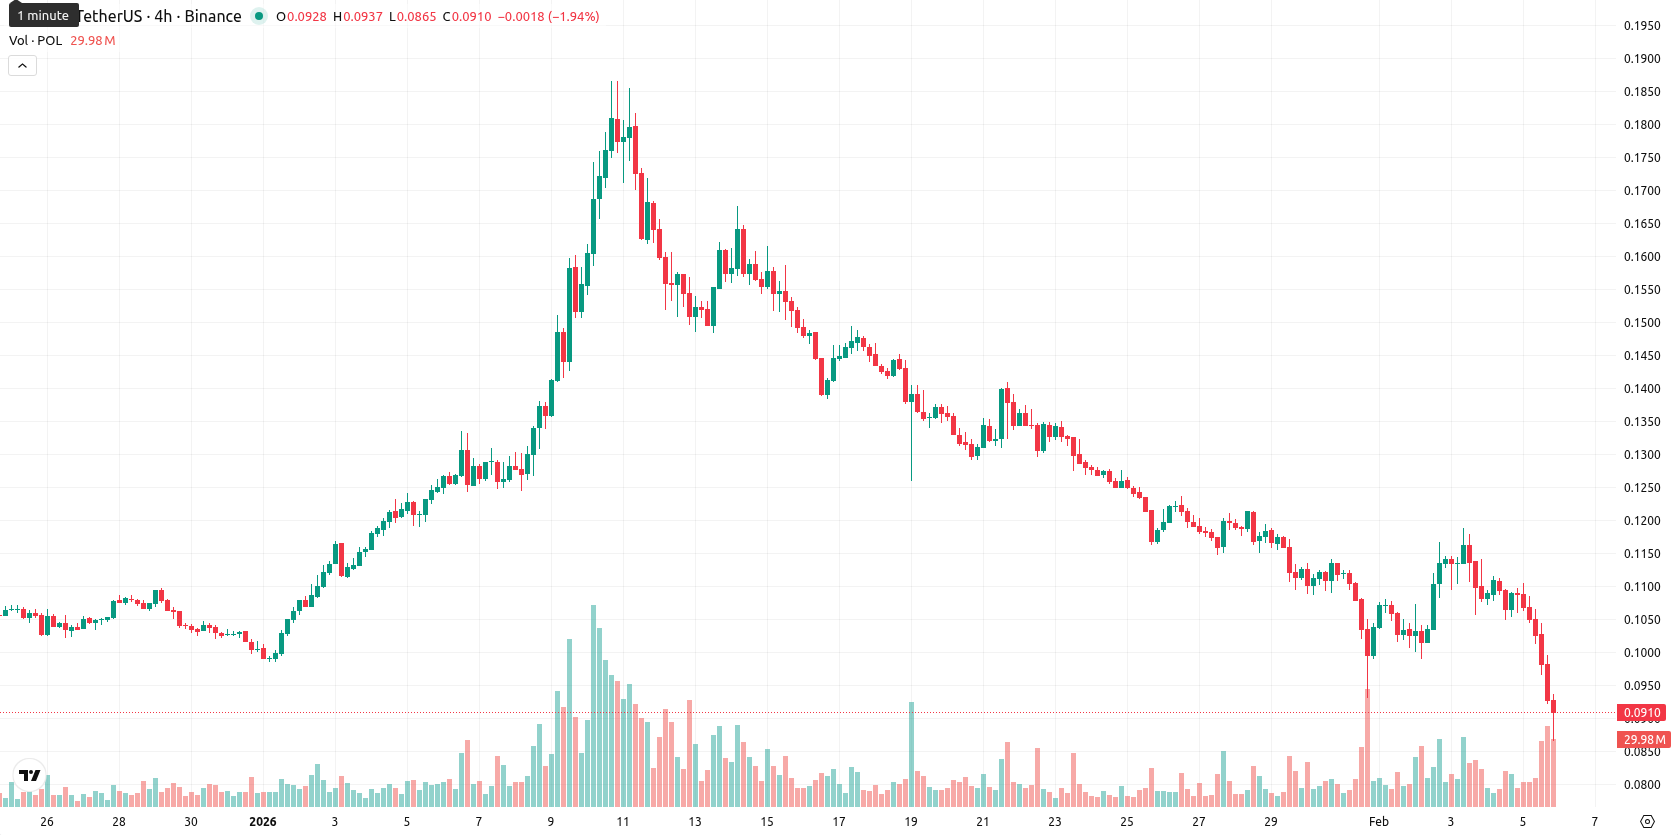
Polygon (POL, formerly MATIC) is trading at $0.095 after a sharp daily decline of 10.63%. The price remains well below the MA-20 ($0.1227), MA-50 ($0.1225), and MA-200 ($0.1851), highlighting continued bearish momentum relative to all key moving averages.
Highlights
- Polygon completed a 25.9 million POL token burn to reduce supply, supporting long-term value creation as new capital entered from Ethereum.
- Polygon advanced institutional adoption with real-world asset tokenization, $1.18 billion in non-USD stablecoin settlements in Latin America, and Europe's first regulated onchain equity token launch.
- POL trades at $0.095, well below MA-20 ($0.1227) and MA-200 ($0.1851), with bearish momentum and a high likelihood of further downside below $0.085.
Supply reduction and asset tokenization drive network adoption
Polygon recently completed a 25.9 million POL token burn to lower supply, supporting longer-term value creation as new capital entered the network from Ethereum. Institutional adoption advanced further with the tokenization of real-world assets and infrastructure, while Polygon strengthened its position as a top platform for non-USD stablecoin settlement, especially in Latin America, where stablecoin transfers reached $1.18 billion. The launch of Europe's first fully regulated onchain equity token, achieved through a collaboration between BeToken and Beself Brands on Polygon, also underscores expanding use cases for the network.
Technical momentum stays negative as support remains absent
Technical analysis remains decidedly bearish, as POL trades far beneath the MA-20, MA-50, and MA-200. There is no nearby dynamic support, with the Ichimoku Kijun resistance at $0.1399 blocking any upside attempts. Momentum indicators confirm persistent weakness: MACD gives a Sell signal, ADX favors sellers, the RSI is low at 38.8, and both the Stochastic RSI and Commodity Channel Index are at or near oversold territory. The Bull/Bear Power is negative and the Awesome Oscillator mirrors the prevailing downtrend, while intraday volatility highlights strong downward pressure near today’s low.
Downside scenario prevails amid low rebound probability
Over the next five trading days, the expected volatility band for POL is between $0.085 and $0.105 based on current levels. The probability of a rebound remains below 20%, suggesting further downside is much more likely. However, should the price close above $0.105, a move towards dynamic resistance at $0.1225 could follow. The main scenario remains limited, sideways movement, but a break below $0.085 would likely open the way for further declines in line with persistent negative momentum signals.
Last time, analysts noted that Polygon (POL) remains under persistent bearish pressure, trading below all key moving averages with negative momentum confirmed by MACD, ADX, and weak RSI readings, while a lack of strong buyer response suggests continued risk of downside. The asset is expected to consolidate sideways within a defined volatility band, with resistance at the Ichimoku Kijun and momentum oscillators showing little indication of imminent reversal.


-
 Afghanistan
-
 Albania
-
 Algeria
-
 Angola
-
 Argentina
-
 Armenia
-
 Australia
-
 Austria
-
 Azerbaijan
-
 Bahamas
-
 Bahrain
-
 Bangladesh
-
 Belarus
-
 Belgium
-
 Bolivia
-
 Botswana
-
 Brazil
-
 Brunei
-
 Bulgaria
-
 Cambodia
-
 Cameroon
-
 Canada
-
 Chile
Chile
-
 China
China
-
 Colombia
-
 Congo
Congo
-
 Costa Rica
-
 Cote d'Ivoire
-
 Croatia
-
 Cuba
Cuba
-
 Cyprus
-
 Czechia
-
 DR Congo
-
 Denmark
-
 Dominican Republic
-
 Ecuador
-
 Egypt
Egypt
-
 El Salvador
-
 Estonia
-
 Eswatini
-
 Ethiopia
-
 Finland
-
 France
-
 Georgia
-
 Germany
-
 Ghana
Ghana
-
 Greece
-
 Haiti
Haiti
-
 Hong Kong
-
 Hungary
-
 India
India
-
 Indonesia
-
 Iran, Islamic republic
-
 Iraq
Iraq
-
 Ireland
-
 Israel
-
 Italy
Italy
-
 Jamaica
-
 Japan
Japan
-
 Jordan
-
 Kazakhstan
-
 Kenya
Kenya
-
 Korea
Korea
-
 Kuwait
-
 Kyrgyzstan
-
 Laos
Laos
-
 Latvia
-
 Lebanon
-
 Lesotho
-
 Libya
Libya
-
 Lithuania
-
 Luxembourg
-
 Madagascar
-
 Malaysia
-
 Malta
Malta
-
 Mauritius
-
 Mexico
-
 Moldova
-
 Mongolia
-
 Montenegro
-
 Morocco
-
 Mozambique
-
 Myanmar
-
 Namibia
-
 Nepal
Nepal
-
 Netherlands
-
 New Zealand
-
 Nigeria
-
 North Macedonia
-
 Norway
-
 Oman
Oman
-
 Pakistan
-
 Palestine
-
 Panama
-
 Papua New Guinea
-
 Paraguay
-
 Peru
Peru
-
 Philippines
-
 Poland
-
 Portugal
-
 Puerto Rico
-
 Qatar
Qatar
-
 Reunion
-
 Romania
-
 Rwanda
-
 Saudi Arabia
-
 Serbia
-
 Singapore
-
 Slovakia
-
 Slovenia
-
 Somalia
-
 South Africa
-
 Spain
Spain
-
 Sri Lanka
-
 Sweden
-
 Switzerland
-
 Syria
Syria
-
 Taiwan
-
 Tajikistan
-
 Tanzania
-
 Thailand
-
 Trinidad and Tobago
-
 Tunisia
-
 Turkey
-
 UAE
UAE
-
 Uganda
-
 Ukraine
-
 United Kingdom
-
United States
-
 Uruguay
-
 Uzbekistan
-
 Venezuela
-
 Vietnam
-
 Yemen
Yemen
-
 Zambia
-
 Zimbabwe
- Forex
- Crypto
