
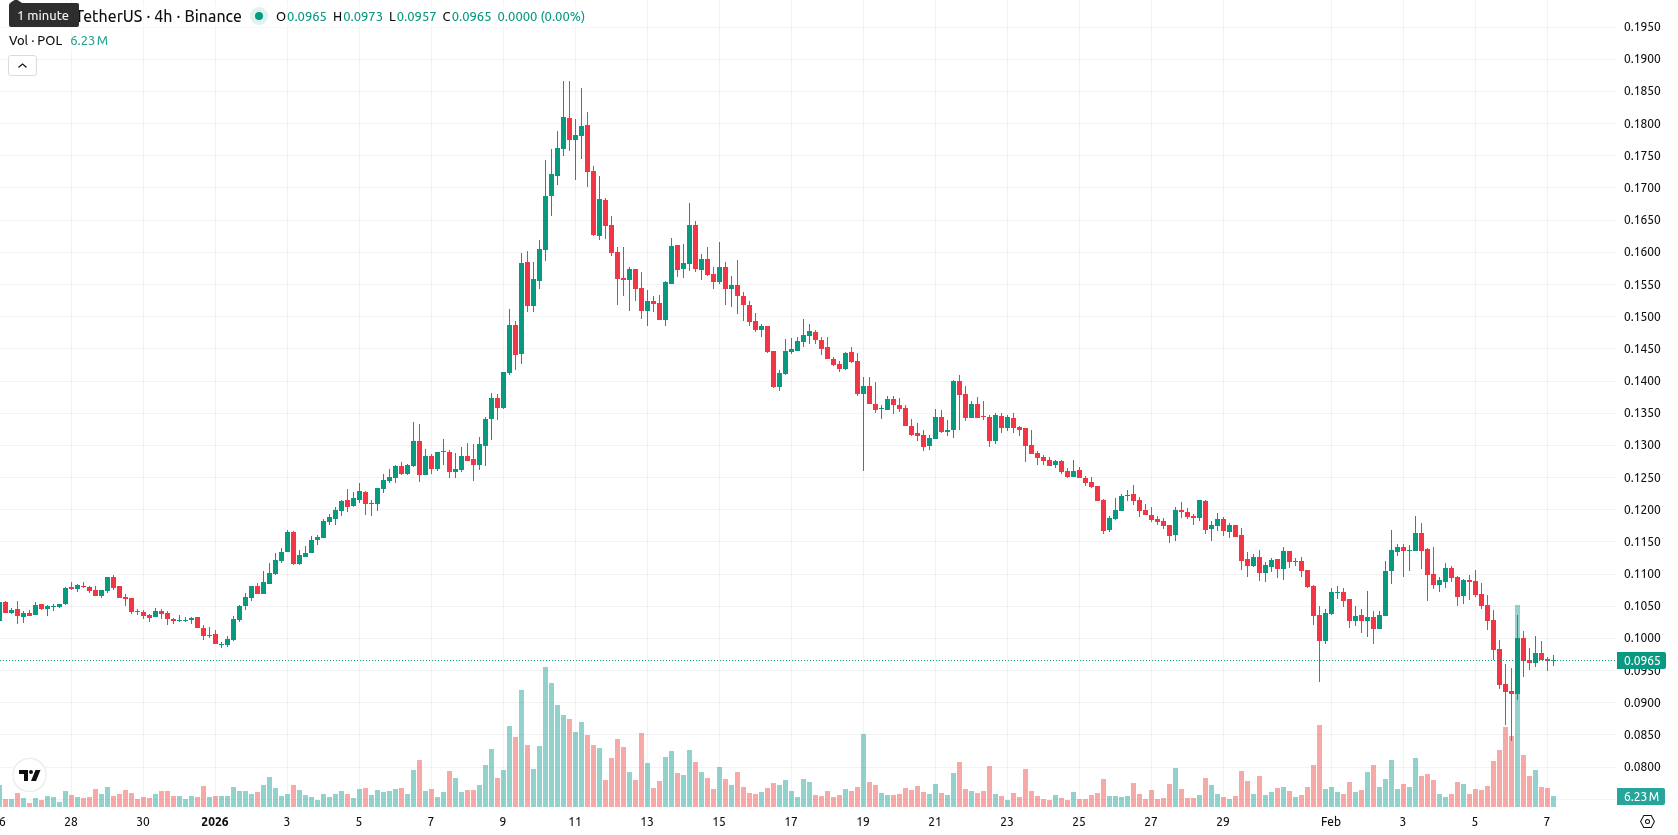
Polygon slides 5.84% to $0.0969 as MACD and ADX reinforce downside, challenging Ichimoku Kijun resistance – weekly analysis

Polygon (POL, formerly MATIC) closed the week with a notable decline, losing $0.0048 or 4.72% over the past seven days. The asset currently trades well below its weekly MA-20 ($0.1177), MA-50 ($0.1221), and MA-200 ($0.1835), signaling persistent downward momentum and sustained pressure from sellers on all major time horizons.
Highlights
- POL trades significantly below its MA-20 ($0.1177), MA-50 ($0.1221), and MA-200 ($0.1835), confirming persistent selling pressure across all timeframes.
- Bearish momentum prevails, with MACD, ADX, negative Bull/Bear Power, and a 4.72% daily drop, while RSI (35.66) and CCI (-139.31) indicate near-oversold conditions.
- The next five-day range is projected at $0.0900–$0.1050, with less than 20% chance of sustained upside and risk of further declines below $0.0900 if support fails.
On-chain activity surges as payments and tokenization fuel adoption
Polygon saw a significant increase in on-chain activity in the final quarter, with $3.57 billion in payments processed. Growth was driven by routine transactions, stablecoin transfers, and tokenized assets, including Mastercard and Visa card programs that moved nearly $363 million. Low transaction fees and fast settlement further boosted network usage, reflecting expanding adoption for everyday spending and tokenization.
Bearish technicals persist as POL nears oversold territory
Weekly technical indicators confirm a bearish outlook, as POL trades well below its key moving averages and faces immediate dynamic resistance at the Ichimoku Kijun ($0.1258). The weekly RSI reads 35.66 and the CCI is at -139.31, both suggesting the asset is approaching oversold territory, although the Stochastic RSI signals a possible short-term rebound. MACD and ADX both indicate ongoing bearish momentum, with negative Bull/Bear Power and moderate volatility consolidating the downside pressure.
Sideways consolidation likely as reversal risks remain subdued
For the coming week, POL is expected to consolidate within a $0.0900 – $0.1050 range, with a very low probability (under 20%) of a sustained reversal higher. The baseline scenario points to sideways movement, while a close above $0.1050 could challenge dynamic resistance. If the price falls below $0.0900, further declines are likely as support may give way.
Previously it was reported that Polygon (POL) remains under sustained bearish pressure, trading below its 20-, 50-, and 200-day moving averages with dynamic resistance near $0.1360. Despite a volatile intraday rally and oversold conditions on multiple momentum indicators, persistent negative signals from MACD and ADX suggest the current rebound lacks confirmation and is vulnerable to further downside.


-
 Afghanistan
-
 Albania
-
 Algeria
-
 Angola
-
 Argentina
-
 Armenia
-
 Australia
-
 Austria
-
 Azerbaijan
-
 Bahamas
-
 Bahrain
-
 Bangladesh
-
 Belarus
-
 Belgium
-
 Bolivia
-
 Botswana
-
 Brazil
-
 Brunei
-
 Bulgaria
-
 Cambodia
-
 Cameroon
-
 Canada
-
 Chile
Chile
-
 China
China
-
 Colombia
-
 Congo
Congo
-
 Costa Rica
-
 Cote d'Ivoire
-
 Croatia
-
 Cuba
Cuba
-
 Cyprus
-
 Czechia
-
 DR Congo
-
 Denmark
-
 Dominican Republic
-
 Ecuador
-
 Egypt
Egypt
-
 El Salvador
-
 Estonia
-
 Eswatini
-
 Ethiopia
-
 Finland
-
 France
-
 Georgia
-
 Germany
-
 Ghana
Ghana
-
 Greece
-
 Haiti
Haiti
-
 Hong Kong
-
 Hungary
-
 India
India
-
 Indonesia
-
 Iran, Islamic republic
-
 Iraq
Iraq
-
 Ireland
-
 Israel
-
 Italy
Italy
-
 Jamaica
-
 Japan
Japan
-
 Jordan
-
 Kazakhstan
-
 Kenya
Kenya
-
 Korea
Korea
-
 Kuwait
-
 Kyrgyzstan
-
 Laos
Laos
-
 Latvia
-
 Lebanon
-
 Lesotho
-
 Libya
Libya
-
 Lithuania
-
 Luxembourg
-
 Madagascar
-
 Malaysia
-
 Malta
Malta
-
 Mauritius
-
 Mexico
-
 Moldova
-
 Mongolia
-
 Montenegro
-
 Morocco
-
 Mozambique
-
 Myanmar
-
 Namibia
-
 Nepal
Nepal
-
 Netherlands
-
 New Zealand
-
 Nigeria
-
 North Macedonia
-
 Norway
-
 Oman
Oman
-
 Pakistan
-
 Palestine
-
 Panama
-
 Papua New Guinea
-
 Paraguay
-
 Peru
Peru
-
 Philippines
-
 Poland
-
 Portugal
-
 Puerto Rico
-
 Qatar
Qatar
-
 Reunion
-
 Romania
-
 Rwanda
-
 Saudi Arabia
-
 Serbia
-
 Singapore
-
 Slovakia
-
 Slovenia
-
 Somalia
-
 South Africa
-
 Spain
Spain
-
 Sri Lanka
-
 Sweden
-
 Switzerland
-
 Syria
Syria
-
 Taiwan
-
 Tajikistan
-
 Tanzania
-
 Thailand
-
 Trinidad and Tobago
-
 Tunisia
-
 Turkey
-
 UAE
UAE
-
 Uganda
-
 Ukraine
-
 United Kingdom
-
United States
-
 Uruguay
-
 Uzbekistan
-
 Venezuela
-
 Vietnam
-
 Yemen
Yemen
-
 Zambia
-
 Zimbabwe
- Forex
- Crypto
