
Immutable X drops as technicals warn of further losses, with dynamic resistance at $0.2195 – weekly report

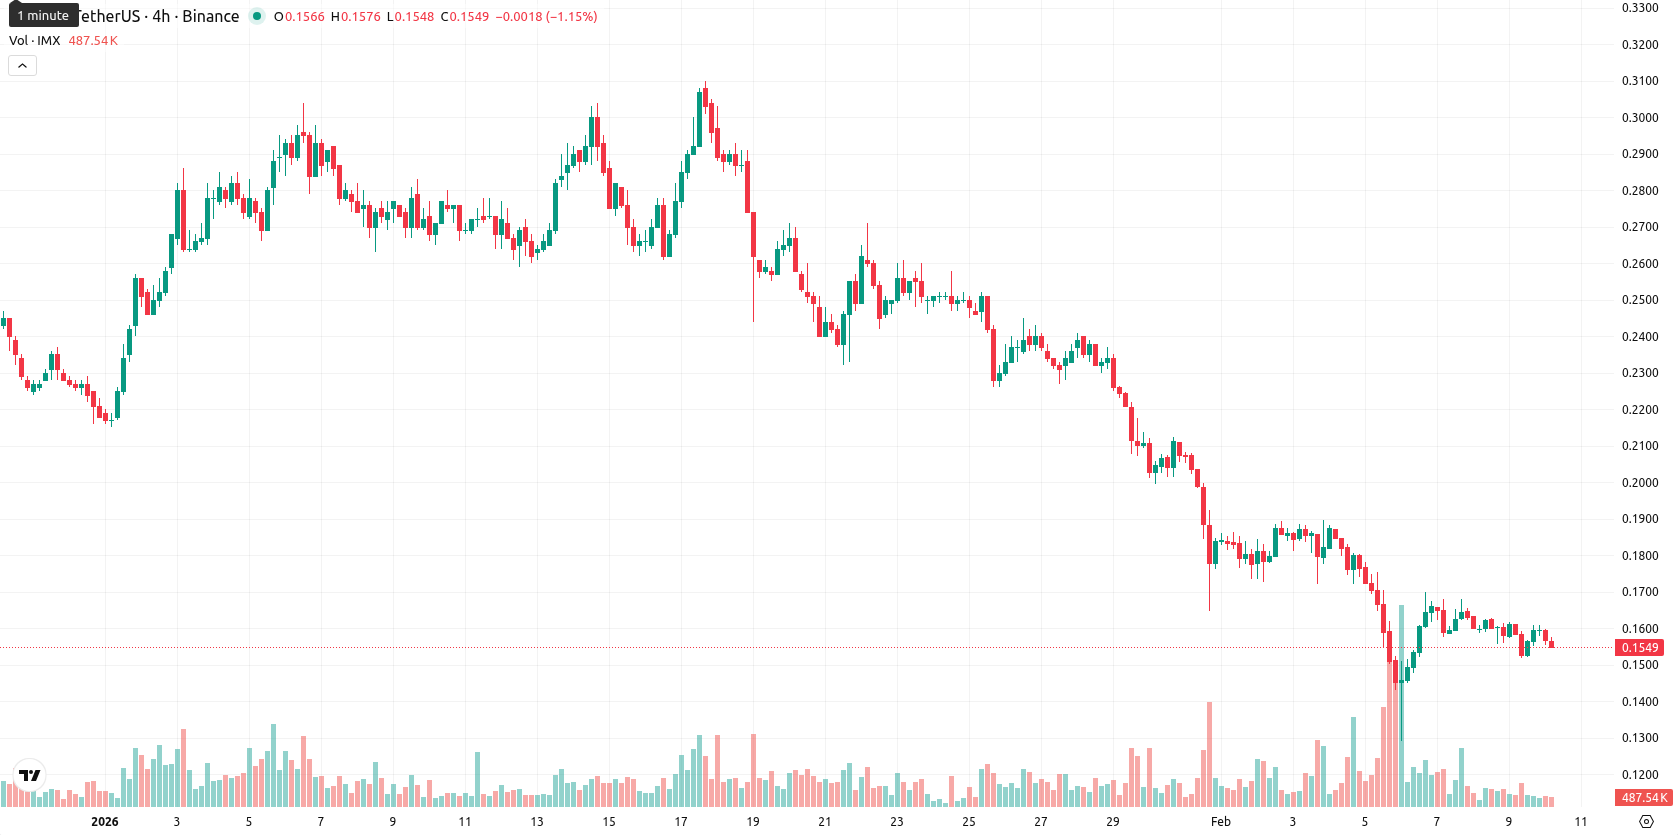
Immutable X (IMX) is currently trading at $0.155, marking a weekly decline as the asset moved lower and settled 2.52% below last week's close. IMX remains well below its key W1 moving averages — MA-20 at $0.2028, MA-50 at $0.2365, and MA-200 at $0.4386 — underscoring persistent selling pressure and a firmly bearish trend across all major timeframes.
Highlights
- IMX is trading at $0.155, significantly below its MA-20 ($0.2028), MA-50 ($0.2365), and MA-200 ($0.4386), reflecting persistent selling pressure across all timeframes.
- Momentum indicators including MACD, ADX, RSI (32), and CCI (–90) point to weak, near-oversold conditions, with intraday and daily signals confirming continued bearish control.
- Expected trading range for the coming week is $0.153 to $0.163, with less than a 20% chance of upside and further declines likely if support at $0.153 fails.
Sustained bearish momentum confirmed as weekly indicators weaken further
On the weekly chart, IMX is positioned significantly beneath all primary moving averages (MA-20, MA-50, and MA-200), reflecting sustained bearish momentum. The nearest dynamic resistance is found at the Ichimoku Kijun level of $0.2195, with no major W1-based support visible below the current price according to trend indicators. Momentum indicators on the weekly timeframe remain negative, with the RSI at 32 and CCI at –90 suggesting weak, near-oversold conditions. The overarching bias remains to the downside, as other signals including MACD, ADX, Bull/Bear Power, and the Awesome Oscillator also confirm continued selling dominance.
Sideways-to-bearish bias expected as breakout risk remains low next week
For the upcoming week, IMX is expected to trade within a narrow range between $0.153 and $0.163, adhering to a sideways-to-bearish outlook. The probability of a short-term price increase stands at less than 20%, favoring further downside or ongoing consolidation. Should a bullish move develop, a breakout above $0.163 may target resistance at $0.170. Conversely, a drop below $0.153 could expose IMX to additional losses.
Last time, analysts noted that Immutable X is trading well below its major moving averages, with sustained bearish momentum underscored by negative MACD and ADX readings, despite a modest intraday gain. Momentum oscillators including RSI and CCI now show oversold conditions, but with key resistance around the Ichimoku Kijun and undefined Ichimoku support, suggesting the asset is likely to consolidate sideways within a defined range amid prevailing seller dominance.


-
 Afghanistan
-
 Albania
-
 Algeria
-
 Angola
-
 Argentina
-
 Armenia
-
 Australia
-
 Austria
-
 Azerbaijan
-
 Bahamas
-
 Bahrain
-
 Bangladesh
-
 Belarus
-
 Belgium
-
 Bolivia
-
 Botswana
-
 Brazil
-
 Brunei
-
 Bulgaria
-
 Cambodia
-
 Cameroon
-
 Canada
-
 Chile
Chile
-
 China
China
-
 Colombia
-
 Congo
Congo
-
 Costa Rica
-
 Cote d'Ivoire
-
 Croatia
-
 Cuba
Cuba
-
 Cyprus
-
 Czechia
-
 DR Congo
-
 Denmark
-
 Dominican Republic
-
 Ecuador
-
 Egypt
Egypt
-
 El Salvador
-
 Estonia
-
 Eswatini
-
 Ethiopia
-
 Finland
-
 France
-
 Georgia
-
 Germany
-
 Ghana
Ghana
-
 Greece
-
 Haiti
Haiti
-
 Hong Kong
-
 Hungary
-
 India
India
-
 Indonesia
-
 Iran, Islamic republic
-
 Iraq
Iraq
-
 Ireland
-
 Israel
-
 Italy
Italy
-
 Jamaica
-
 Japan
Japan
-
 Jordan
-
 Kazakhstan
-
 Kenya
Kenya
-
 Korea
Korea
-
 Kuwait
-
 Kyrgyzstan
-
 Laos
Laos
-
 Latvia
-
 Lebanon
-
 Lesotho
-
 Libya
Libya
-
 Lithuania
-
 Luxembourg
-
 Madagascar
-
 Malaysia
-
 Malta
Malta
-
 Mauritius
-
 Mexico
-
 Moldova
-
 Mongolia
-
 Montenegro
-
 Morocco
-
 Mozambique
-
 Myanmar
-
 Namibia
-
 Nepal
Nepal
-
 Netherlands
-
 New Zealand
-
 Nigeria
-
 North Macedonia
-
 Norway
-
 Oman
Oman
-
 Pakistan
-
 Palestine
-
 Panama
-
 Papua New Guinea
-
 Paraguay
-
 Peru
Peru
-
 Philippines
-
 Poland
-
 Portugal
-
 Puerto Rico
-
 Qatar
Qatar
-
 Reunion
-
 Romania
-
 Rwanda
-
 Saudi Arabia
-
 Serbia
-
 Singapore
-
 Slovakia
-
 Slovenia
-
 Somalia
-
 South Africa
-
 Spain
Spain
-
 Sri Lanka
-
 Sweden
-
 Switzerland
-
 Syria
Syria
-
 Taiwan
-
 Tajikistan
-
 Tanzania
-
 Thailand
-
 Trinidad and Tobago
-
 Tunisia
-
 Turkey
-
 UAE
UAE
-
 Uganda
-
 Ukraine
-
 United Kingdom
-
United States
-
 Uruguay
-
 Uzbekistan
-
 Venezuela
-
 Vietnam
-
 Yemen
Yemen
-
 Zambia
-
 Zimbabwe
- Forex
- Crypto
