
+7.14% for Theta — price remains under pressure below key moving averages

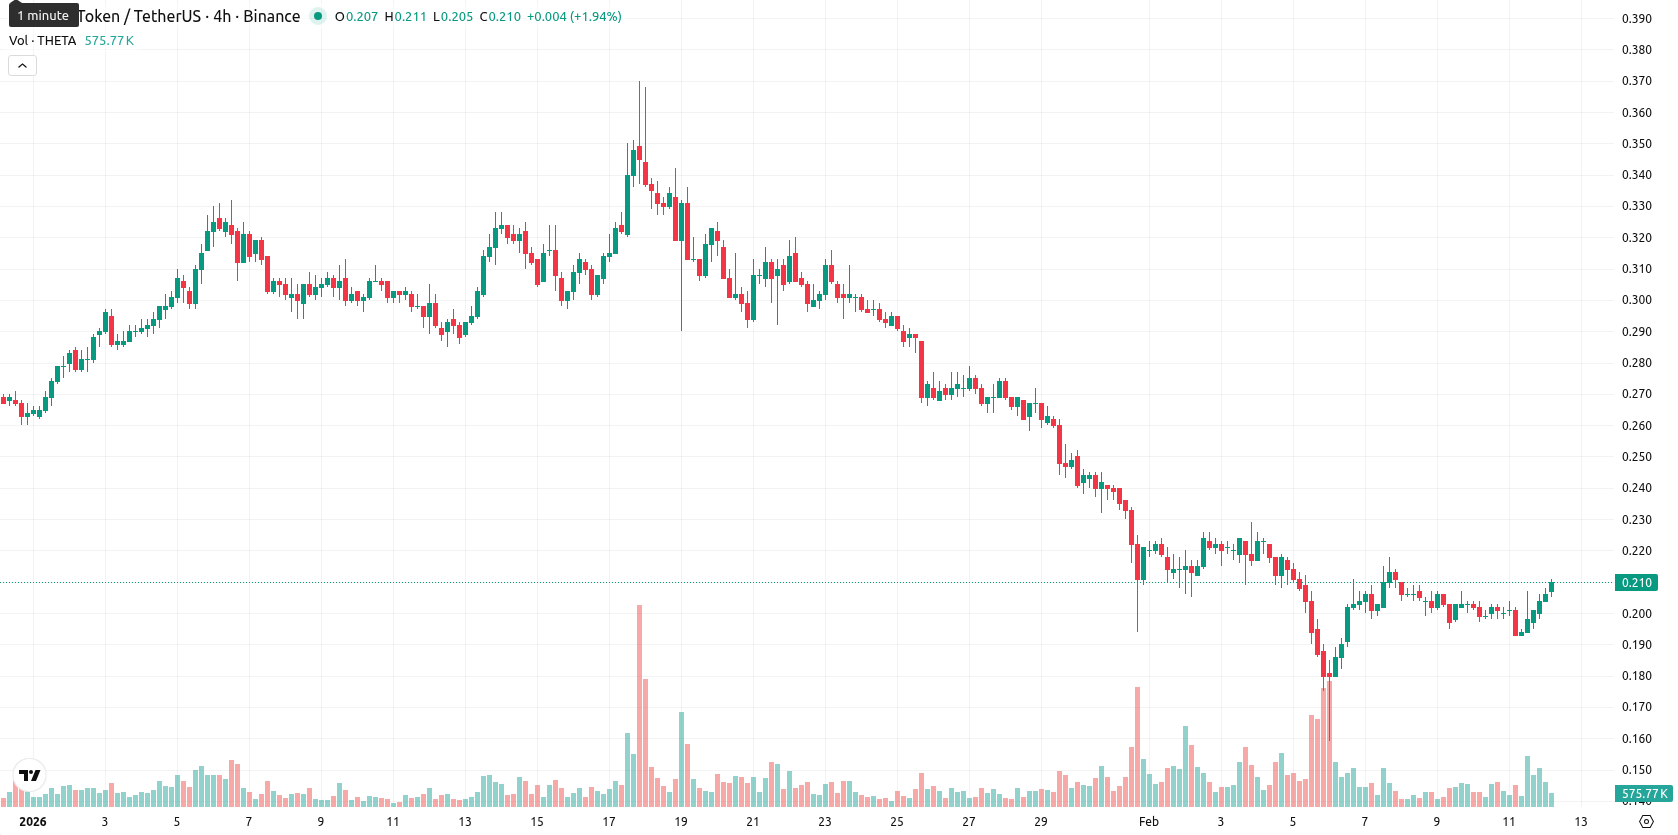
Theta (THETA) is trading at $0.21, below the MA-20 ($0.2331), MA-50 ($0.2710), and MA-200 ($0.5237), highlighting persistent bearish pressure across all major timeframes. The session showed an upward move, but the asset remains under key moving averages, indicating it is still positioned in a downtrend.
Highlights
- THETA is trading at $0.21, below the MA-20 ($0.2331), MA-50 ($0.2710), and MA-200 ($0.5237), reflecting persistent bearish momentum across all timeframes.
- Momentum indicators including MACD, ADX, RSI, and Stochastic RSI remain firmly bearish, with the downside favored and sellers dominating intraday action.
- Expect continued sideways trading between $0.20 and $0.24 over the next 5 days; a sustained break below $0.20 could trigger further declines.
Bearish momentum confirmed as resistance and weak oscillators persist
Technical conditions for THETA remain weak overall, as short-, medium-, and long-term moving averages are all positioned above the current price, affirming sustained selling pressure. The nearest significant resistance is the Ichimoku Kijun at $0.2645, while short-term support lies near the previous session’s open at $0.204. Momentum indicators such as MACD and ADX confirm a bearish structure on the daily timeframe. Intraday action shows sellers in control, as seen from the overbought Stochastic RSI and negative Bull/Bear Power readings, while the RSI and CCI stay in bearish territory. The Awesome Oscillator is neutral and does not suggest a reversal.
Sideways range favored amid stalled bullish signals and key resistance
For the next five sessions, THETA is likely to remain within a typical volatility band between $0.20 and $0.24, as the lack of bullish momentum across all weekly indicators limits the probability of sustained gains (less than 20%). A sideways trading scenario within this range is most probable unless a break above the Ichimoku Kijun and MA-50 near $0.2645 triggers additional upside. Conversely, if THETA slips below $0.20, further support downdrafts could be exposed.
Last time, analysts noted that Theta is trading well below all major moving averages, with sustained bearish momentum confirmed by weak MACD, strong ADX, and oversold RSI and CCI readings, while resistance at the Ichimoku Kijun level remains solid and support is unconfirmed. The outlook calls for range-bound movement with downside risk prevailing, as technical signals point to high probability of continued weakness unless a breakout above current resistance occurs.


Latest Theta News


-
 Afghanistan
-
 Albania
-
 Algeria
-
 Angola
-
 Argentina
-
 Armenia
-
 Australia
-
 Austria
-
 Azerbaijan
-
 Bahamas
-
 Bahrain
-
 Bangladesh
-
 Belarus
-
 Belgium
-
 Bolivia
-
 Botswana
-
 Brazil
-
 Brunei
-
 Bulgaria
-
 Cambodia
-
 Cameroon
-
 Canada
-
 Chile
Chile
-
 China
China
-
 Colombia
-
 Congo
Congo
-
 Costa Rica
-
 Cote d'Ivoire
-
 Croatia
-
 Cuba
Cuba
-
 Cyprus
-
 Czechia
-
 DR Congo
-
 Denmark
-
 Dominican Republic
-
 Ecuador
-
 Egypt
Egypt
-
 El Salvador
-
 Estonia
-
 Eswatini
-
 Ethiopia
-
 Finland
-
 France
-
 Georgia
-
 Germany
-
 Ghana
Ghana
-
 Greece
-
 Haiti
Haiti
-
 Hong Kong
-
 Hungary
-
 India
India
-
 Indonesia
-
 Iran, Islamic republic
-
 Iraq
Iraq
-
 Ireland
-
 Israel
-
 Italy
Italy
-
 Jamaica
-
 Japan
Japan
-
 Jordan
-
 Kazakhstan
-
 Kenya
Kenya
-
 Korea
Korea
-
 Kuwait
-
 Kyrgyzstan
-
 Laos
Laos
-
 Latvia
-
 Lebanon
-
 Lesotho
-
 Libya
Libya
-
 Lithuania
-
 Luxembourg
-
 Madagascar
-
 Malaysia
-
 Malta
Malta
-
 Mauritius
-
 Mexico
-
 Moldova
-
 Mongolia
-
 Montenegro
-
 Morocco
-
 Mozambique
-
 Myanmar
-
 Namibia
-
 Nepal
Nepal
-
 Netherlands
-
 New Zealand
-
 Nigeria
-
 North Macedonia
-
 Norway
-
 Oman
Oman
-
 Pakistan
-
 Palestine
-
 Panama
-
 Papua New Guinea
-
 Paraguay
-
 Peru
Peru
-
 Philippines
-
 Poland
-
 Portugal
-
 Puerto Rico
-
 Qatar
Qatar
-
 Reunion
-
 Romania
-
 Rwanda
-
 Saudi Arabia
-
 Serbia
-
 Singapore
-
 Slovakia
-
 Slovenia
-
 Somalia
-
 South Africa
-
 Spain
Spain
-
 Sri Lanka
-
 Sweden
-
 Switzerland
-
 Syria
Syria
-
 Taiwan
-
 Tajikistan
-
 Tanzania
-
 Thailand
-
 Trinidad and Tobago
-
 Tunisia
-
 Turkey
-
 UAE
UAE
-
 Uganda
-
 Ukraine
-
 United Kingdom
-
United States
-
 Uruguay
-
 Uzbekistan
-
 Venezuela
-
 Vietnam
-
 Yemen
Yemen
-
 Zambia
-
 Zimbabwe
- Forex
- Crypto
