
+9.47% for Theta — volatility spikes on weak support and bearish technicals

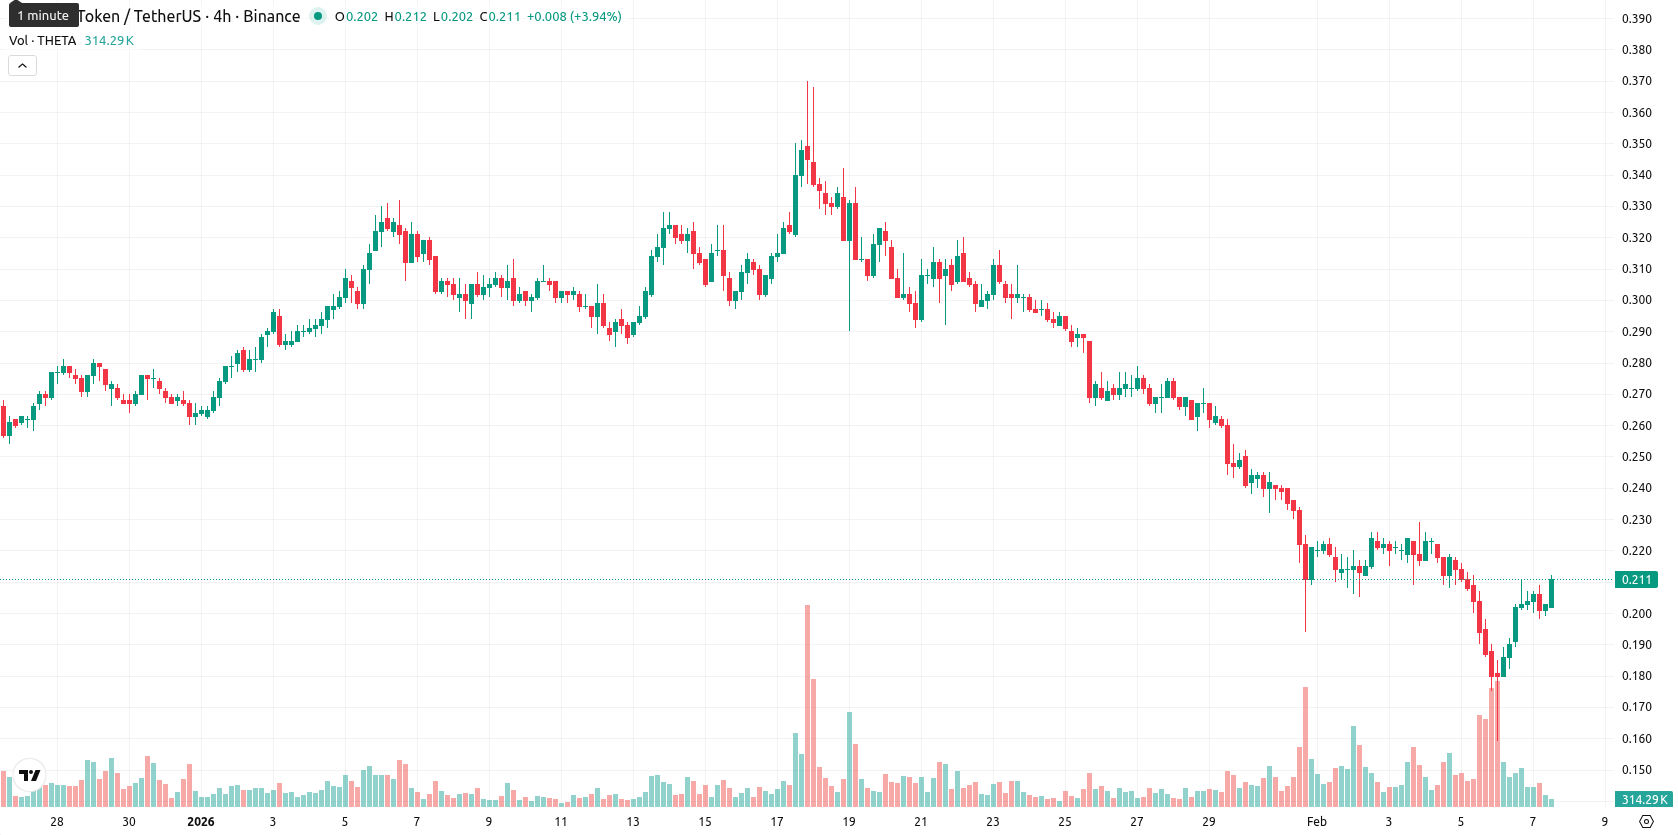
Theta (THETA) is trading at $0.208, showing a notable daily decline and remaining well below the MA-20 ($0.2593), MA-50 ($0.2791), and MA-200 ($0.5411). This positions the asset under persistent downward pressure across all major moving averages.
Highlights
- THETA is trading at $0.208, significantly below its MA-20 ($0.2593), MA-50 ($0.2791), and MA-200 ($0.5411), indicating persistent downward momentum across all timeframes.
- Momentum indicators show broad bearishness: MACD remains in sell territory, ADX signals a strong bearish trend, and the RSI is close to oversold at 33.6.
- Near-term price action is expected within $0.198–$0.229, with technical signals suggesting over an 80% probability of further downside unless resistance at $0.230 is decisively breached.
Momentum softness and volatility as resistance limits upside
Technically, the closest dynamic resistance is at the Ichimoku Kijun level of $0.2665, while support is currently unconfirmed. Momentum remains weak with the MACD in sell territory, a strong bearish ADX, and several oscillators signaling oversold conditions: RSI is at 33.6, CCI is oversold at -118, and Stochastic RSI reveals a strong buy bias with moderate strength, suggesting the potential for intraday rebounds within a bearish trend. Bull/Bear Power and the Awesome Oscillator both underscore continued seller dominance, while a minor bullish gap on the open and price action near today’s high highlight marked volatility despite persistent momentum weakness.
Downside favored as technical signals cap range-bound outlook
For the next five trading days, Theta is expected to remain within a $0.198 – $0.229 range, representing typical volatility around current levels. Technical signals on daily and weekly periods indicate a very high probability (over 80%) of continued downside, with the baseline scenario favoring sideways movement inside this band. A bullish scenario would require a sustained breakout above $0.230, while a bearish development could push the asset to fresh lows below $0.198 if current levels fail to hold.
Previously it was reported that Theta Network is trading below all key moving averages, with sustained downside momentum and oversold readings on RSI and CCI, while MACD and ADX confirm a prevailing bearish bias. Despite today's upward move and intraday strength, resistance at the Ichimoku level remains intact and the long-term trend shows no signs of reversal.


Latest Theta News


-
 Afghanistan
-
 Albania
-
 Algeria
-
 Angola
-
 Argentina
-
 Armenia
-
 Australia
-
 Austria
-
 Azerbaijan
-
 Bahamas
-
 Bahrain
-
 Bangladesh
-
 Belarus
-
 Belgium
-
 Bolivia
-
 Botswana
-
 Brazil
-
 Brunei
-
 Bulgaria
-
 Cambodia
-
 Cameroon
-
 Canada
-
 Chile
Chile
-
 China
China
-
 Colombia
-
 Congo
Congo
-
 Costa Rica
-
 Cote d'Ivoire
-
 Croatia
-
 Cuba
Cuba
-
 Cyprus
-
 Czechia
-
 DR Congo
-
 Denmark
-
 Dominican Republic
-
 Ecuador
-
 Egypt
Egypt
-
 El Salvador
-
 Estonia
-
 Eswatini
-
 Ethiopia
-
 Finland
-
 France
-
 Georgia
-
 Germany
-
 Ghana
Ghana
-
 Greece
-
 Haiti
Haiti
-
 Hong Kong
-
 Hungary
-
 India
India
-
 Indonesia
-
 Iran, Islamic republic
-
 Iraq
Iraq
-
 Ireland
-
 Israel
-
 Italy
Italy
-
 Jamaica
-
 Japan
Japan
-
 Jordan
-
 Kazakhstan
-
 Kenya
Kenya
-
 Korea
Korea
-
 Kuwait
-
 Kyrgyzstan
-
 Laos
Laos
-
 Latvia
-
 Lebanon
-
 Lesotho
-
 Libya
Libya
-
 Lithuania
-
 Luxembourg
-
 Madagascar
-
 Malaysia
-
 Malta
Malta
-
 Mauritius
-
 Mexico
-
 Moldova
-
 Mongolia
-
 Montenegro
-
 Morocco
-
 Mozambique
-
 Myanmar
-
 Namibia
-
 Nepal
Nepal
-
 Netherlands
-
 New Zealand
-
 Nigeria
-
 North Macedonia
-
 Norway
-
 Oman
Oman
-
 Pakistan
-
 Palestine
-
 Panama
-
 Papua New Guinea
-
 Paraguay
-
 Peru
Peru
-
 Philippines
-
 Poland
-
 Portugal
-
 Puerto Rico
-
 Qatar
Qatar
-
 Reunion
-
 Romania
-
 Rwanda
-
 Saudi Arabia
-
 Serbia
-
 Singapore
-
 Slovakia
-
 Slovenia
-
 Somalia
-
 South Africa
-
 Spain
Spain
-
 Sri Lanka
-
 Sweden
-
 Switzerland
-
 Syria
Syria
-
 Taiwan
-
 Tajikistan
-
 Tanzania
-
 Thailand
-
 Trinidad and Tobago
-
 Tunisia
-
 Turkey
-
 UAE
UAE
-
 Uganda
-
 Ukraine
-
 United Kingdom
-
United States
-
 Uruguay
-
 Uzbekistan
-
 Venezuela
-
 Vietnam
-
 Yemen
Yemen
-
 Zambia
-
 Zimbabwe
- Forex
- Crypto
