
POL declines to $0.1007 with price action stuck under resistance at $0.1124 and flat TVL – weekly forecast

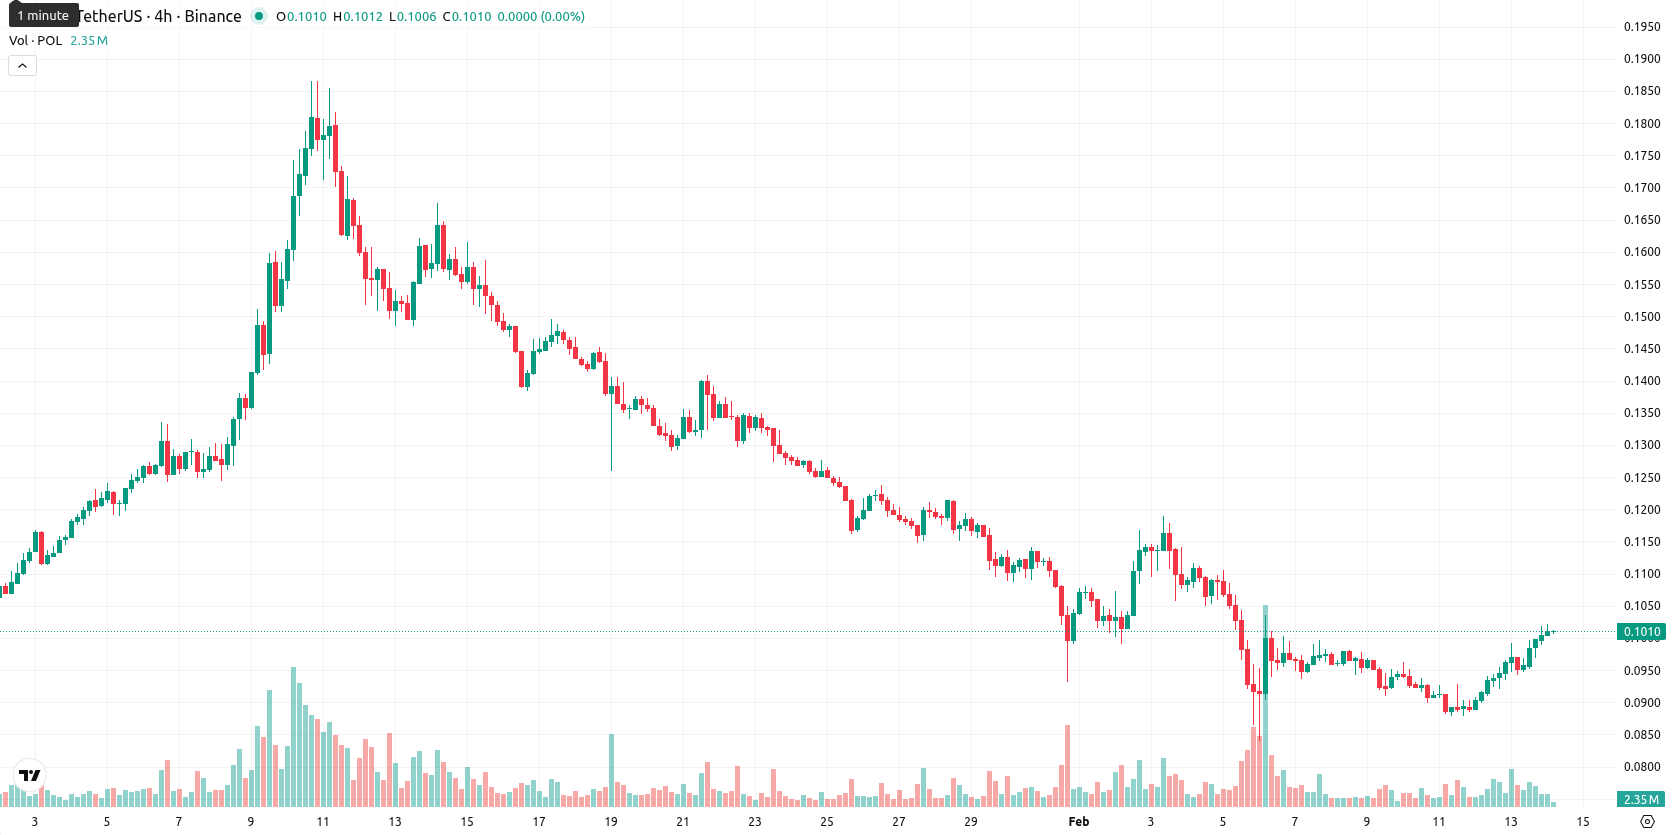
Polygon (POL, formerly MATIC) closed the week at $0.1007, declining both in absolute and percentage terms over the last 7 days. The current price is positioned below the key W1 moving averages — MA-20 ($0.1045), MA-50 ($0.1204), and MA-200 ($0.1785) — reinforcing a sustained bearish trend across all time horizons.
Highlights
- POL trades at $0.1007, remaining below key moving averages MA-20 ($0.1045), MA-50 ($0.1204), and MA-200 ($0.1785), signaling multi-horizon downward pressure.
- Momentum indicators are mixed: MACD and RSI remain bearish (RSI 43.4), while Stochastic RSI is overbought at 100, with marginal intraday buyer strength emerging.
- Expected five-day price range is $0.0920–$0.1100, with low upside probability (<20%) and main risk a breakdown below support at $0.0943 toward $0.0920.
Accumulation by major holders contrasts with stable TVL and new proposals
The Polygon Foundation has continued its rollout of new governance proposals aimed at strengthening its position as a leading agentic blockchain. Long-term holders, including whales, have increased their holdings by about 16% since early February, suggesting ongoing accumulation. Total value locked (TVL) has remained steady, reflecting continued support for the protocol’s recovery and development.
Persistent bearish bias builds as technicals confirm low volatility
On the weekly chart, POL remains under pressure, trading below its MA-20, MA-50, and MA-200, highlighting persistent bearish sentiment. The closest dynamic resistance is the Ichimoku Kijun at $0.1124, while dynamic support is around the MA-5 at $0.0943. Weekly RSI stands at 43.4, showing sellers’ dominance, and the MACD remains negative, further signaling a bearish bias. Weekly oscillators indicate low volatility and moderate downward momentum, with the broader trend lacking any strong reversal signals.
Sideways-to-bearish bias expected as breakout odds remain subdued
For the next 5–7 trading days, POL is likely to stay within a sideways range of $0.0920 to $0.1100, consistent with recent weekly volatility. The probability of an upward breakout is low, with bearish weekly indicators dominating the outlook. A move above $0.1124 would open up the potential for a short-term rally toward the MA-50 ($0.1204), but the baseline scenario is sideways to bearish. A break below weekly support at $0.0943 may accelerate losses to $0.0920 or lower if selling pressure intensifies.
Last time, analysts noted that Polygon (POL) continues to face bearish pressure, trading below major moving averages with technical signals such as MACD, ADX, and daily RSI pointing to negative momentum and a tilt toward oversold territory. Immediate resistance is seen near $0.1150, while support lies at $0.0890, indicating likely continued consolidation or downside in the near term with limited breakout probability.


-
 Afghanistan
-
 Albania
-
 Algeria
-
 Angola
-
 Argentina
-
 Armenia
-
 Australia
-
 Austria
-
 Azerbaijan
-
 Bahamas
-
 Bahrain
-
 Bangladesh
-
 Belarus
-
 Belgium
-
 Bolivia
-
 Botswana
-
 Brazil
-
 Brunei
-
 Bulgaria
-
 Cambodia
-
 Cameroon
-
 Canada
-
 Chile
Chile
-
 China
China
-
 Colombia
-
 Congo
Congo
-
 Costa Rica
-
 Cote d'Ivoire
-
 Croatia
-
 Cuba
Cuba
-
 Cyprus
-
 Czechia
-
 DR Congo
-
 Denmark
-
 Dominican Republic
-
 Ecuador
-
 Egypt
Egypt
-
 El Salvador
-
 Estonia
-
 Eswatini
-
 Ethiopia
-
 Finland
-
 France
-
 Georgia
-
 Germany
-
 Ghana
Ghana
-
 Greece
-
 Haiti
Haiti
-
 Hong Kong
-
 Hungary
-
 India
India
-
 Indonesia
-
 Iran, Islamic republic
-
 Iraq
Iraq
-
 Ireland
-
 Israel
-
 Italy
Italy
-
 Jamaica
-
 Japan
Japan
-
 Jordan
-
 Kazakhstan
-
 Kenya
Kenya
-
 Korea
Korea
-
 Kuwait
-
 Kyrgyzstan
-
 Laos
Laos
-
 Latvia
-
 Lebanon
-
 Lesotho
-
 Libya
Libya
-
 Lithuania
-
 Luxembourg
-
 Madagascar
-
 Malaysia
-
 Malta
Malta
-
 Mauritius
-
 Mexico
-
 Moldova
-
 Mongolia
-
 Montenegro
-
 Morocco
-
 Mozambique
-
 Myanmar
-
 Namibia
-
 Nepal
Nepal
-
 Netherlands
-
 New Zealand
-
 Nigeria
-
 North Macedonia
-
 Norway
-
 Oman
Oman
-
 Pakistan
-
 Palestine
-
 Panama
-
 Papua New Guinea
-
 Paraguay
-
 Peru
Peru
-
 Philippines
-
 Poland
-
 Portugal
-
 Puerto Rico
-
 Qatar
Qatar
-
 Reunion
-
 Romania
-
 Rwanda
-
 Saudi Arabia
-
 Serbia
-
 Singapore
-
 Slovakia
-
 Slovenia
-
 Somalia
-
 South Africa
-
 Spain
Spain
-
 Sri Lanka
-
 Sweden
-
 Switzerland
-
 Syria
Syria
-
 Taiwan
-
 Tajikistan
-
 Tanzania
-
 Thailand
-
 Trinidad and Tobago
-
 Tunisia
-
 Turkey
-
 UAE
UAE
-
 Uganda
-
 Ukraine
-
 United Kingdom
-
United States
-
 Uruguay
-
 Uzbekistan
-
 Venezuela
-
 Vietnam
-
 Yemen
Yemen
-
 Zambia
-
 Zimbabwe
- Forex
- Crypto
