
XRP price prediction: Sideways volatility or breakout ahead? XRP gains 4.10%

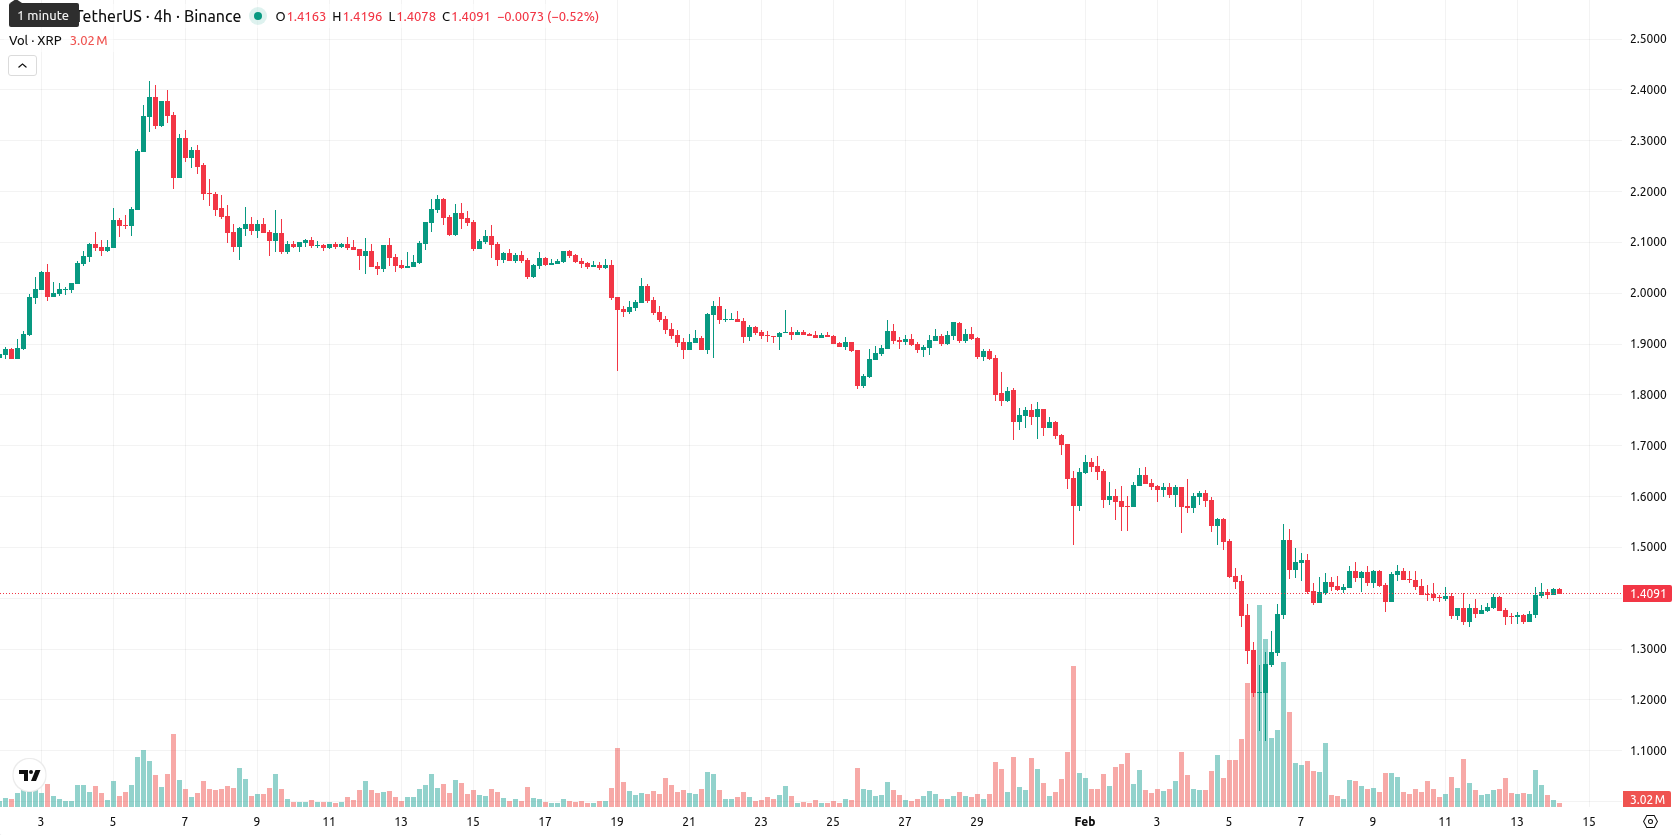
XRP (XRP) is trading at $1.4086, up $0.0555 or 4.10% on the day, and remains well below key moving averages — MA-20 ($1.5785), MA-50 ($1.8412), and MA-200 ($2.4020) — highlighting ongoing bearish pressure across all timeframes.
Highlights
- Ripple has executed approximately $4 billion in crypto sector investments, mergers, and acquisitions, highlighting an aggressive commitment to ecosystem expansion.
- Brazil’s launch of its first spot XRP ETF marks regulatory progress and rising digital asset adoption, despite fluctuating institutional demand and ledger use for cross-border payments.
- XRP trades at $1.4086, under key moving averages; major support is at $1.27 and resistance at $1.54, with technicals signaling continued downward pressure.
Corporate expansion and technical upgrades shape shifting institutional flows
Ripple has completed approximately $4 billion in investments, mergers, and acquisitions within the crypto sector, underscoring a significant corporate commitment to expanding its ecosystem. The XRP Ledger's recent activation of the XLS-85 token escrow upgrade enhances native token escrow support and could increase institutional use cases, depending on adoption. Additionally, Brazil's launch of its first spot XRP ETF reflects regulatory progress and growing digital asset adoption. Institutional interest in XRP has been fluctuating, with inflows and outflows affecting spot ETF holdings and the ledger seeing greater cross-border payment and stablecoin activity.
Bearish momentum persists as XRP faces resistance and indicator divergence
Persistently negative momentum defines the technical outlook: XRP trades beneath its MA-20, MA-50, and MA-200, with the Ichimoku Kijun ($1.5736) as the nearest dynamic resistance and round-number levels offering support. The MACD signals strong sell, ADX confirms robust bearish strength, and both RSI (35.66) and CCI (–71.24) are clearly bearish — while an overbought Stochastic RSI (99.56) points to possible short-term exhaustion. Negative Bull/Bear Power further emphasizes that sellers control momentum. Price action hovers near today’s session highs with moderate volatility, but conflicting oscillators warn of near-term divergence.
Sideways correction favored as technical risk points lower barring breakout
In the short term, XRP is likely to remain volatile within a $1.27 to $1.54 price band, reflecting typical fluctuations relative to current levels. The probability of a sustained price increase is low, with further downside more likely given negative daily and weekly technical signals. If XRP breaks above the $1.54 resistance near the Kijun level, additional gains could follow; a move below $1.27, however, would likely intensify bearish momentum and accelerate declines. Overall, expect a sideways correction near current prices unless a clear breakout or breakdown occurs.
Last time, analysts noted that XRP is consolidating near short-term support, with price action stabilizing around flattening 20 and 50-period EMAs, while remaining capped beneath the 100 and 200-period EMAs which constrain upside momentum. The market structure remains range-bound between $1.30 and $1.43, with balanced volume participation and a neutral-to-slightly bearish bias until a decisive move above resistance or below support occurs.


-
 Afghanistan
-
 Albania
-
 Algeria
-
 Angola
-
 Argentina
-
 Armenia
-
 Australia
-
 Austria
-
 Azerbaijan
-
 Bahamas
-
 Bahrain
-
 Bangladesh
-
 Belarus
-
 Belgium
-
 Bolivia
-
 Botswana
-
 Brazil
-
 Brunei
-
 Bulgaria
-
 Cambodia
-
 Cameroon
-
 Canada
-
 Chile
Chile
-
 China
China
-
 Colombia
-
 Congo
Congo
-
 Costa Rica
-
 Cote d'Ivoire
-
 Croatia
-
 Cuba
Cuba
-
 Cyprus
-
 Czechia
-
 DR Congo
-
 Denmark
-
 Dominican Republic
-
 Ecuador
-
 Egypt
Egypt
-
 El Salvador
-
 Estonia
-
 Eswatini
-
 Ethiopia
-
 Finland
-
 France
-
 Georgia
-
 Germany
-
 Ghana
Ghana
-
 Greece
-
 Haiti
Haiti
-
 Hong Kong
-
 Hungary
-
 India
India
-
 Indonesia
-
 Iran, Islamic republic
-
 Iraq
Iraq
-
 Ireland
-
 Israel
-
 Italy
Italy
-
 Jamaica
-
 Japan
Japan
-
 Jordan
-
 Kazakhstan
-
 Kenya
Kenya
-
 Korea
Korea
-
 Kuwait
-
 Kyrgyzstan
-
 Laos
Laos
-
 Latvia
-
 Lebanon
-
 Lesotho
-
 Libya
Libya
-
 Lithuania
-
 Luxembourg
-
 Madagascar
-
 Malaysia
-
 Malta
Malta
-
 Mauritius
-
 Mexico
-
 Moldova
-
 Mongolia
-
 Montenegro
-
 Morocco
-
 Mozambique
-
 Myanmar
-
 Namibia
-
 Nepal
Nepal
-
 Netherlands
-
 New Zealand
-
 Nigeria
-
 North Macedonia
-
 Norway
-
 Oman
Oman
-
 Pakistan
-
 Palestine
-
 Panama
-
 Papua New Guinea
-
 Paraguay
-
 Peru
Peru
-
 Philippines
-
 Poland
-
 Portugal
-
 Puerto Rico
-
 Qatar
Qatar
-
 Reunion
-
 Romania
-
 Rwanda
-
 Saudi Arabia
-
 Serbia
-
 Singapore
-
 Slovakia
-
 Slovenia
-
 Somalia
-
 South Africa
-
 Spain
Spain
-
 Sri Lanka
-
 Sweden
-
 Switzerland
-
 Syria
Syria
-
 Taiwan
-
 Tajikistan
-
 Tanzania
-
 Thailand
-
 Trinidad and Tobago
-
 Tunisia
-
 Turkey
-
 UAE
UAE
-
 Uganda
-
 Ukraine
-
 United Kingdom
-
United States
-
 Uruguay
-
 Uzbekistan
-
 Venezuela
-
 Vietnam
-
 Yemen
Yemen
-
 Zambia
-
 Zimbabwe
- Forex
- Crypto
