
Pepe: Bullish technicals and high volatility drive gains despite looming regulatory threat

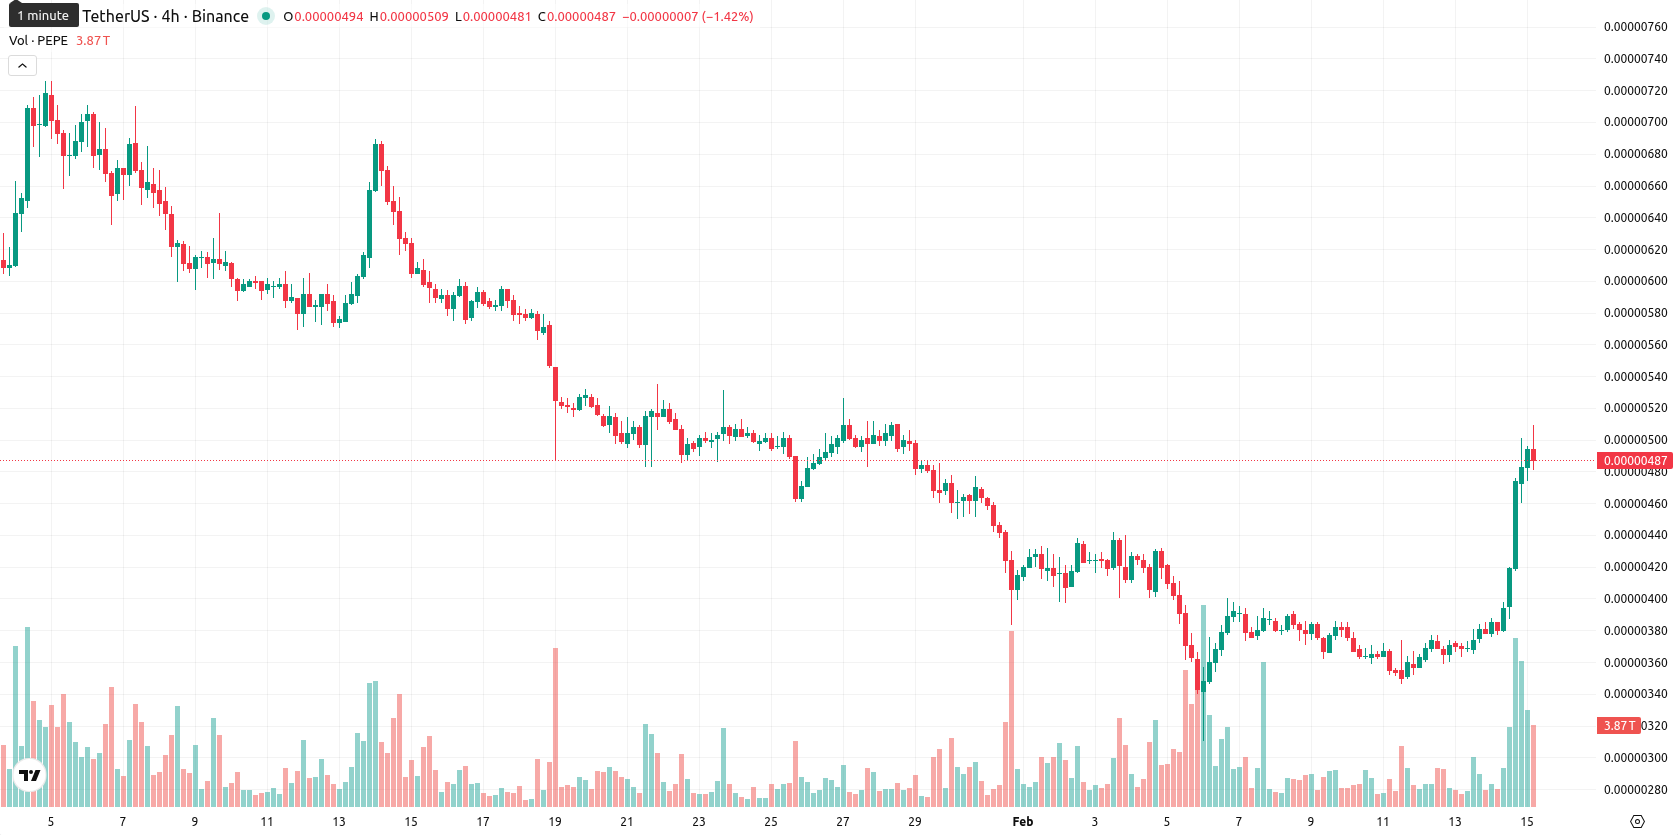
Pepe (PEPE) is currently trading at $0.0000049, sitting above the MA-20 ($0.00000418), just under the MA-50 ($0.00000499), and well below the MA-200 ($0.00000711). This setup points to short- and medium-term bullish momentum, while longer-term trends remain under bearish pressure.
Highlights
- Ongoing regulatory uncertainty remains a significant risk for Pepe, with increased government scrutiny potentially impacting accessibility, liquidity, and speculative interest, according to Benzinga on February 15, 2026.
- Despite regulatory headwinds, Pepe has not reported any recent product launches, regulatory actions, or on-chain upgrades, leaving growth largely dependent on broader crypto market trends.
- PEPE surged 28.76% to $0.0000049, trading above the MA-20 but below the MA-200, with consolidation likely between $0.00000458 and $0.00000510 over five sessions amid heightened volatility.
Regulatory scrutiny limits growth as adoption offers modest upside
On February 15, 2026, Benzinga highlighted that ongoing regulatory uncertainty is a significant risk factor for Pepe, as increased government scrutiny and the potential for restrictive policies could impact accessibility, liquidity, and speculative interest. Stricter rules on speculative assets may hinder the token's growth, though broader crypto adoption could provide some moderate upside. No confirmed product launches, major regulatory actions, or on-chain upgrades specific to Pepe have been reported recently.
Conflicting momentum signals as price nears resistance zone
The nearest dynamic support for PEPE is near the Ichimoku Kijun at $0.00000422, with resistance at the MA-50 and the round $0.0000050 level. Momentum signals are mixed: the MACD gives a Strong Sell on both daily and weekly timeframes, while the ADX suggests moderate trend strength on D1 but shifts to neutral for the week. Oscillators are sending warnings — RSI D1 is bullish at 57, Stochastic RSI is heavily overbought at 100, and the CCI remains positive though not extreme. Bull/Bear Power indicates active buyer dominance intraday, while the Awesome Oscillator is neutral.
Range-bound trading likely as pullback risk surpasses breakout odds
For the next five trading days, PEPE is expected to stay within a typical volatility band of $0.00000458 to $0.00000510. There is a very low probability (less than 20%) of a sustained breakout higher, with a more likely outcome being either a pullback or sideways consolidation. The baseline scenario is for price action to hold between $0.00000458 and $0.00000510, as short-term buyers and longer-term sellers compete for direction. A bullish case would require a break above $0.0000050 – $0.00000510, while a bearish outcome is possible if price drops below $0.00000458, putting recent support and the Ichimoku Kijun level at risk.
Last time, analysts noted that Pepe (PEPE) was trading above its short-term moving average but remained below key medium- and long-term averages, reflecting short-term bullish momentum within an overall capped trend. Technical indicators show a mixed picture as mild bullish signals and sustained social trading coincide with overbought conditions and heightened volatility, highlighting potential for near-term exhaustion despite ongoing buyer interest.


Latest PEPE/USD News


-
 Afghanistan
-
 Albania
-
 Algeria
-
 Angola
-
 Argentina
-
 Armenia
-
 Australia
-
 Austria
-
 Azerbaijan
-
 Bahamas
-
 Bahrain
-
 Bangladesh
-
 Belarus
-
 Belgium
-
 Bolivia
-
 Botswana
-
 Brazil
-
 Brunei
-
 Bulgaria
-
 Cambodia
-
 Cameroon
-
 Canada
-
 Chile
Chile
-
 China
China
-
 Colombia
-
 Congo
Congo
-
 Costa Rica
-
 Cote d'Ivoire
-
 Croatia
-
 Cuba
Cuba
-
 Cyprus
-
 Czechia
-
 DR Congo
-
 Denmark
-
 Dominican Republic
-
 Ecuador
-
 Egypt
Egypt
-
 El Salvador
-
 Estonia
-
 Eswatini
-
 Ethiopia
-
 Finland
-
 France
-
 Georgia
-
 Germany
-
 Ghana
Ghana
-
 Greece
-
 Haiti
Haiti
-
 Hong Kong
-
 Hungary
-
 India
India
-
 Indonesia
-
 Iran, Islamic republic
-
 Iraq
Iraq
-
 Ireland
-
 Israel
-
 Italy
Italy
-
 Jamaica
-
 Japan
Japan
-
 Jordan
-
 Kazakhstan
-
 Kenya
Kenya
-
 Korea
Korea
-
 Kuwait
-
 Kyrgyzstan
-
 Laos
Laos
-
 Latvia
-
 Lebanon
-
 Lesotho
-
 Libya
Libya
-
 Lithuania
-
 Luxembourg
-
 Madagascar
-
 Malaysia
-
 Malta
Malta
-
 Mauritius
-
 Mexico
-
 Moldova
-
 Mongolia
-
 Montenegro
-
 Morocco
-
 Mozambique
-
 Myanmar
-
 Namibia
-
 Nepal
Nepal
-
 Netherlands
-
 New Zealand
-
 Nigeria
-
 North Macedonia
-
 Norway
-
 Oman
Oman
-
 Pakistan
-
 Palestine
-
 Panama
-
 Papua New Guinea
-
 Paraguay
-
 Peru
Peru
-
 Philippines
-
 Poland
-
 Portugal
-
 Puerto Rico
-
 Qatar
Qatar
-
 Reunion
-
 Romania
-
 Rwanda
-
 Saudi Arabia
-
 Serbia
-
 Singapore
-
 Slovakia
-
 Slovenia
-
 Somalia
-
 South Africa
-
 Spain
Spain
-
 Sri Lanka
-
 Sweden
-
 Switzerland
-
 Syria
Syria
-
 Taiwan
-
 Tajikistan
-
 Tanzania
-
 Thailand
-
 Trinidad and Tobago
-
 Tunisia
-
 Turkey
-
 UAE
UAE
-
 Uganda
-
 Ukraine
-
 United Kingdom
-
United States
-
 Uruguay
-
 Uzbekistan
-
 Venezuela
-
 Vietnam
-
 Yemen
Yemen
-
 Zambia
-
 Zimbabwe
- Forex
- Crypto
