
Jupiter gains 14.13% as zero emission plan and airdrop pause drive short-term buying

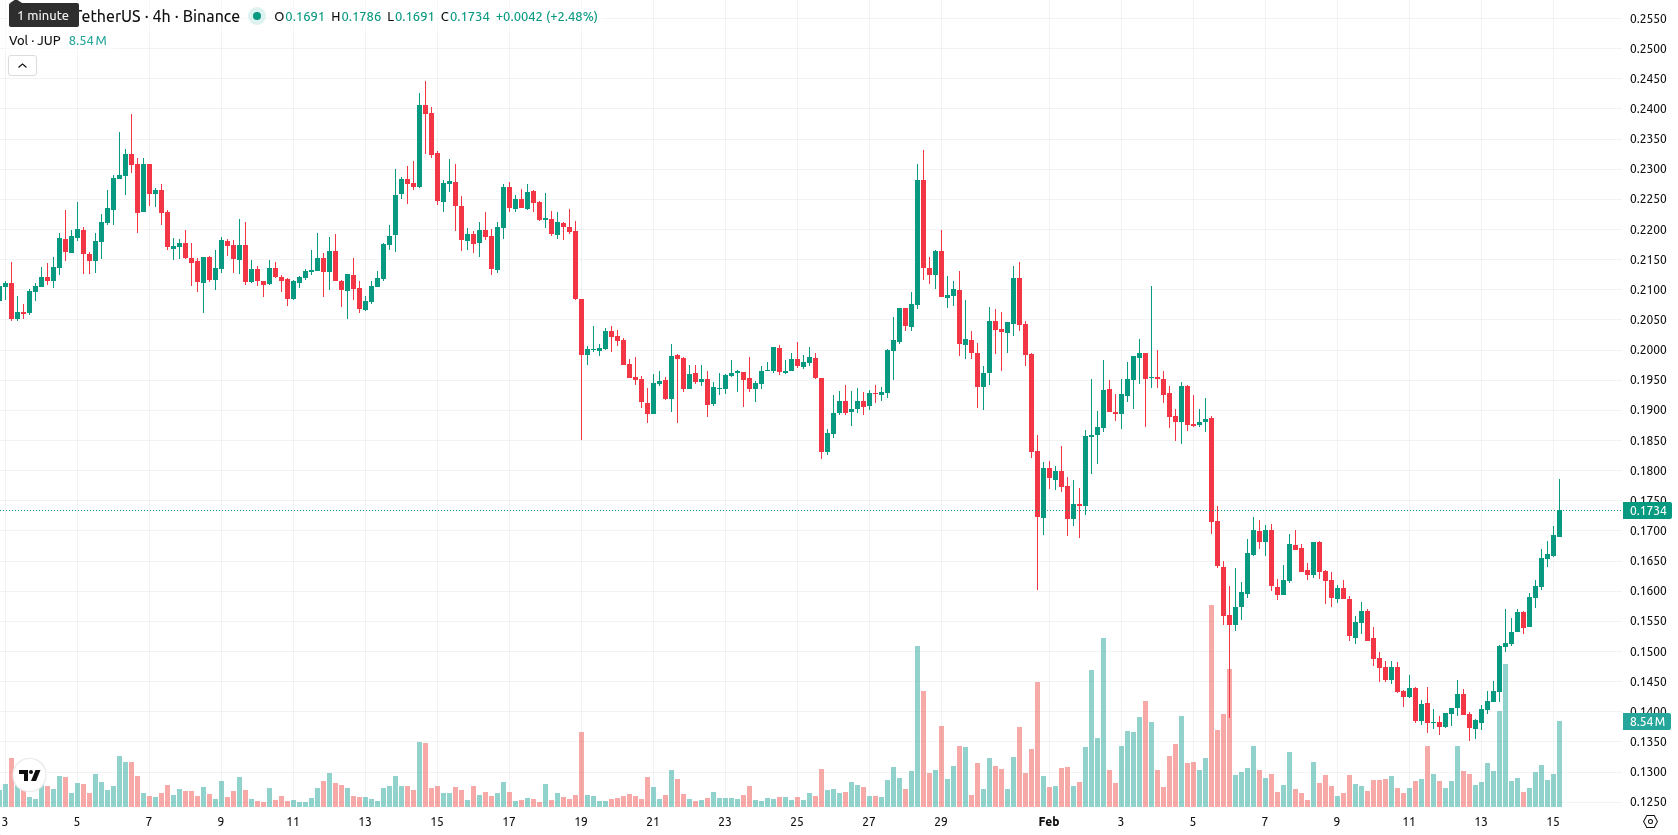
Jupiter (JUP) is trading at $0.1753 after a 14.13% gain on the day, sitting just above its MA-20 ($0.1743) but still well below both the MA-50 ($0.1943) and MA-200 ($0.3398), suggesting buyers have regained some short-term momentum while medium- and long-term trends remain under pressure from sellers.
Highlights
- Jupiter proposed to cut net JUP token emissions to zero by indefinitely postponing the Jupuary airdrop and returning 700 million JUP to the community cold wallet.
- The proposal suspends team token allocations in favor of balance sheet claims, with the project offering to buy back allocations if members choose to sell.
- JUP is trading at $0.1753, near MA-20 support but well below MA-50 ($0.1943) and MA-200 ($0.3398), with technicals signaling high volatility and potential for pullback or consolidation.
Emission cuts and buybacks proposed as governance shifts to community
Jupiter has put forward a governance proposal to cut net JUP token emissions to zero for the foreseeable future, which includes indefinitely postponing the Jupuary airdrop and returning all 700 million JUP allocated for airdrops to the community cold wallet. The plan also suspends team member token allocations in favor of claims on the Jupiter balance sheet, with the project buying back any allocations if a member decides to sell. Additionally, Jupiter is expediting the token unlock process for Mercurial stakeholders and will use its balance sheet to fully hedge any resulting sales, with community voting on the proposal now underway.
Mixed momentum and high volatility as resistance caps recovery
Technically, JUP has reclaimed the MA-20 but remains well beneath the MA-50 and MA-200, which continue to act as resistance and indicate an overall bearish trend. The next notable support is found around the Ichimoku Kijun at $0.1841, while resistance is clustered near the MA-50 at $0.1943. Momentum signals are mixed: the daily MACD and ADX indicate weak or negative momentum, RSI is neutral and not oversold, and the Stochastic RSI shows overbought conditions. Bull/Bear Power points to strong buyer activity on the daily timeframe, with the Awesome Oscillator neutral; intraday volatility remains high, and some oscillators warn of near-term exhaustion.
Range-bound outlook as bullish break or downside risk looms
Over the coming days, JUP is likely to move within a $0.174 to $0.181 band, reflecting typical volatility for current conditions. The probability of a further rise is low (less than 20%), favoring a short-term pullback or sideways consolidation. The base case is for the price to hold steady inside this corridor. However, a breakout above $0.1841 – $0.1943 marks a bullish reversal risk, while a decisive break below $0.174 could trigger renewed downside momentum and deeper declines.
Last time, analysts noted that Jupiter (JUP) is showing short-term buying interest as it trades just above its 20-day moving average, yet remains below the 50- and 200-day averages, indicating lingering medium- and long-term selling pressure. Momentum indicators present mixed signals with a slightly weak RSI and bearish MACD/ADX, highlighting potential exhaustion following a sharp rally and increasing the likelihood of a short-term pause or pullback despite recent upward momentum.


Latest Jupiter News


-
 Afghanistan
-
 Albania
-
 Algeria
-
 Angola
-
 Argentina
-
 Armenia
-
 Australia
-
 Austria
-
 Azerbaijan
-
 Bahamas
-
 Bahrain
-
 Bangladesh
-
 Belarus
-
 Belgium
-
 Bolivia
-
 Botswana
-
 Brazil
-
 Brunei
-
 Bulgaria
-
 Cambodia
-
 Cameroon
-
 Canada
-
 Chile
Chile
-
 China
China
-
 Colombia
-
 Congo
Congo
-
 Costa Rica
-
 Cote d'Ivoire
-
 Croatia
-
 Cuba
Cuba
-
 Cyprus
-
 Czechia
-
 DR Congo
-
 Denmark
-
 Dominican Republic
-
 Ecuador
-
 Egypt
Egypt
-
 El Salvador
-
 Estonia
-
 Eswatini
-
 Ethiopia
-
 Finland
-
 France
-
 Georgia
-
 Germany
-
 Ghana
Ghana
-
 Greece
-
 Haiti
Haiti
-
 Hong Kong
-
 Hungary
-
 India
India
-
 Indonesia
-
 Iran, Islamic republic
-
 Iraq
Iraq
-
 Ireland
-
 Israel
-
 Italy
Italy
-
 Jamaica
-
 Japan
Japan
-
 Jordan
-
 Kazakhstan
-
 Kenya
Kenya
-
 Korea
Korea
-
 Kuwait
-
 Kyrgyzstan
-
 Laos
Laos
-
 Latvia
-
 Lebanon
-
 Lesotho
-
 Libya
Libya
-
 Lithuania
-
 Luxembourg
-
 Madagascar
-
 Malaysia
-
 Malta
Malta
-
 Mauritius
-
 Mexico
-
 Moldova
-
 Mongolia
-
 Montenegro
-
 Morocco
-
 Mozambique
-
 Myanmar
-
 Namibia
-
 Nepal
Nepal
-
 Netherlands
-
 New Zealand
-
 Nigeria
-
 North Macedonia
-
 Norway
-
 Oman
Oman
-
 Pakistan
-
 Palestine
-
 Panama
-
 Papua New Guinea
-
 Paraguay
-
 Peru
Peru
-
 Philippines
-
 Poland
-
 Portugal
-
 Puerto Rico
-
 Qatar
Qatar
-
 Reunion
-
 Romania
-
 Rwanda
-
 Saudi Arabia
-
 Serbia
-
 Singapore
-
 Slovakia
-
 Slovenia
-
 Somalia
-
 South Africa
-
 Spain
Spain
-
 Sri Lanka
-
 Sweden
-
 Switzerland
-
 Syria
Syria
-
 Taiwan
-
 Tajikistan
-
 Tanzania
-
 Thailand
-
 Trinidad and Tobago
-
 Tunisia
-
 Turkey
-
 UAE
UAE
-
 Uganda
-
 Ukraine
-
 United Kingdom
-
United States
-
 Uruguay
-
 Uzbekistan
-
 Venezuela
-
 Vietnam
-
 Yemen
Yemen
-
 Zambia
-
 Zimbabwe
- Forex
- Crypto
