
Maple price prediction: Further downside risks as SYRUP slides 7.3%

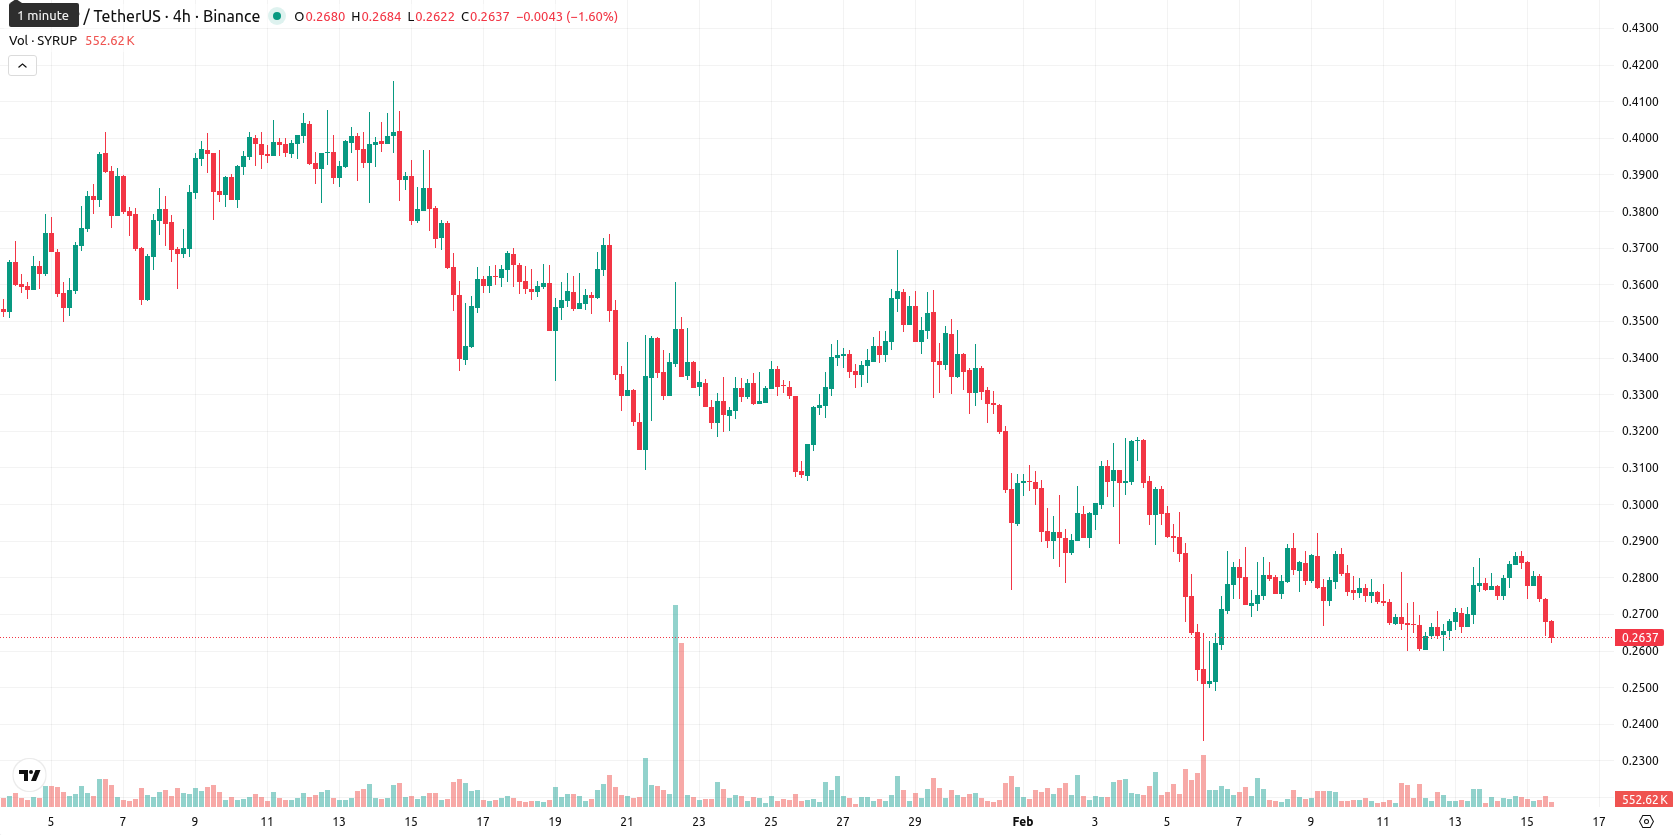
Maple (SYRUP) is trading at $0.2642, which is below the MA-20 ($0.2982), MA-50 ($0.3347), and MA-200 ($0.3780), highlighting persistent downward pressure across all key timeframes. The price remains under the influence of sellers, with no immediate dynamic support levels and proximate resistance at the Ichimoku Kijun level of $0.3045.
Highlights
- SYRUP is trading at $0.2642, below its MA-20 ($0.2982), MA-50 ($0.3347), and MA-200 ($0.3780), reflecting persistent bearish pressure across all time frames.
- Daily MACD shows a strong sell, ADX trend remains bearish, and most momentum indicators confirm sustained seller dominance and a negative intraday tone.
- Key levels to watch are resistance at the Ichimoku Kijun $0.3045 and support at $0.2540; a close below $0.2540 could accelerate downside risk.
Seller dominance intensifies as momentum indicators confirm weakness
Momentum indicators on the daily timeframe underline ongoing weakness: the MACD issues a strong sell, and the ADX trend remains bearish, confirming that sellers dominate. No overbought or oversold signals are detected on the RSI or CCI, but the Stochastic RSI is in the overbought zone, signaling risk of a near-term pullback. Bull/Bear Power is marginally positive, but other momentum readings reflect continued seller advantage, and the Awesome Oscillator is neutral. Intraday, SYRUP opened with a negligible gap and declined 7.3% to close near session lows in a high-volatility session, with most oscillators and momentum indicators reinforcing the negative tone.
Volatility range narrows as downside risks stay heightened
For the coming week, the projected volatility band for SYRUP is between $0.2540 and $0.2786. The likelihood of upward movement is low at less than 20%, with further downside suggested by aligned bearish indications from the daily and weekly MACD and RSI. The base case expects sideways action, with bullish momentum requiring a break above $0.3045 resistance, while a close below $0.2540 could trigger further declines. Downside risks remain elevated in the near term in light of prevailing technical and momentum signals.
Previously it was reported that Maple remains under sustained selling pressure, trading below major moving averages with momentum indicators such as MACD, ADX, and RSI signaling ongoing downside risk and a choppy, oversold environment. Immediate resistance is clustered near $0.2930–$0.3045, while support lies at $0.2680, with price action expected to remain range-bound absent a decisive breakout.


Latest Maple News


-
 Afghanistan
-
 Albania
-
 Algeria
-
 Angola
-
 Argentina
-
 Armenia
-
 Australia
-
 Austria
-
 Azerbaijan
-
 Bahamas
-
 Bahrain
-
 Bangladesh
-
 Belarus
-
 Belgium
-
 Bolivia
-
 Botswana
-
 Brazil
-
 Brunei
-
 Bulgaria
-
 Cambodia
-
 Cameroon
-
 Canada
-
 Chile
Chile
-
 China
China
-
 Colombia
-
 Congo
Congo
-
 Costa Rica
-
 Cote d'Ivoire
-
 Croatia
-
 Cuba
Cuba
-
 Cyprus
-
 Czechia
-
 DR Congo
-
 Denmark
-
 Dominican Republic
-
 Ecuador
-
 Egypt
Egypt
-
 El Salvador
-
 Estonia
-
 Eswatini
-
 Ethiopia
-
 Finland
-
 France
-
 Georgia
-
 Germany
-
 Ghana
Ghana
-
 Greece
-
 Haiti
Haiti
-
 Hong Kong
-
 Hungary
-
 India
India
-
 Indonesia
-
 Iran, Islamic republic
-
 Iraq
Iraq
-
 Ireland
-
 Israel
-
 Italy
Italy
-
 Jamaica
-
 Japan
Japan
-
 Jordan
-
 Kazakhstan
-
 Kenya
Kenya
-
 Korea
Korea
-
 Kuwait
-
 Kyrgyzstan
-
 Laos
Laos
-
 Latvia
-
 Lebanon
-
 Lesotho
-
 Libya
Libya
-
 Lithuania
-
 Luxembourg
-
 Madagascar
-
 Malaysia
-
 Malta
Malta
-
 Mauritius
-
 Mexico
-
 Moldova
-
 Mongolia
-
 Montenegro
-
 Morocco
-
 Mozambique
-
 Myanmar
-
 Namibia
-
 Nepal
Nepal
-
 Netherlands
-
 New Zealand
-
 Nigeria
-
 North Macedonia
-
 Norway
-
 Oman
Oman
-
 Pakistan
-
 Palestine
-
 Panama
-
 Papua New Guinea
-
 Paraguay
-
 Peru
Peru
-
 Philippines
-
 Poland
-
 Portugal
-
 Puerto Rico
-
 Qatar
Qatar
-
 Reunion
-
 Romania
-
 Rwanda
-
 Saudi Arabia
-
 Serbia
-
 Singapore
-
 Slovakia
-
 Slovenia
-
 Somalia
-
 South Africa
-
 Spain
Spain
-
 Sri Lanka
-
 Sweden
-
 Switzerland
-
 Syria
Syria
-
 Taiwan
-
 Tajikistan
-
 Tanzania
-
 Thailand
-
 Trinidad and Tobago
-
 Tunisia
-
 Turkey
-
 UAE
UAE
-
 Uganda
-
 Ukraine
-
 United Kingdom
-
United States
-
 Uruguay
-
 Uzbekistan
-
 Venezuela
-
 Vietnam
-
 Yemen
Yemen
-
 Zambia
-
 Zimbabwe
- Forex
- Crypto
