
LDO posts further losses as Ichimoku Kijun caps rallies, bears dominate MACD and ADX signals – weekly analysis

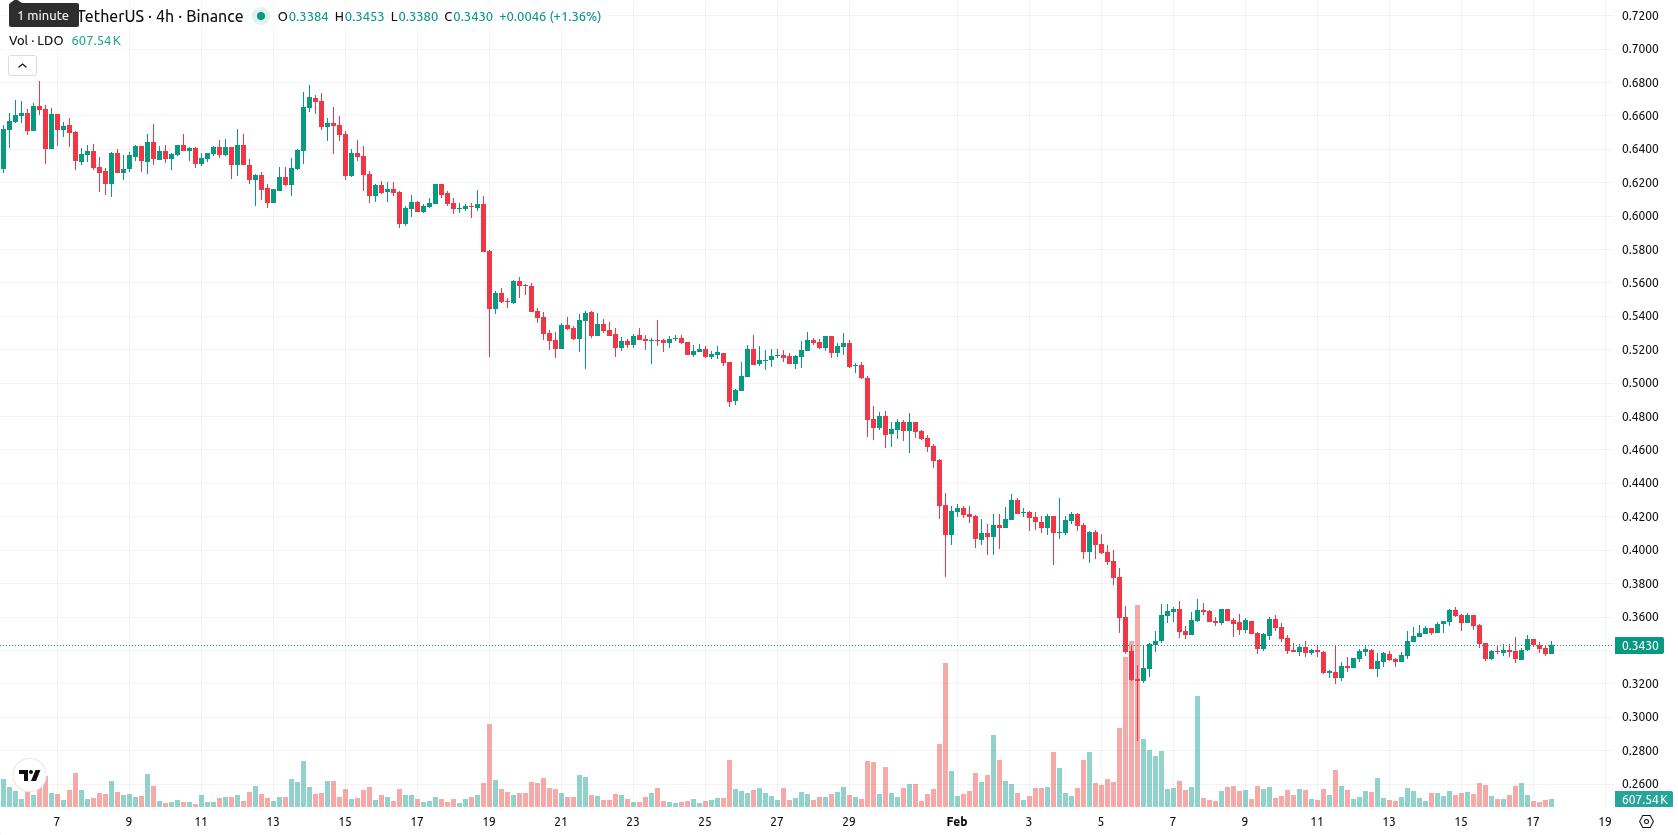
Lido (LDO) is currently trading at $0.3432, marking a decline on the weekly timeframe. Over the last seven days, LDO moved lower both in absolute and percentage terms, closing well beneath its weekly MA-20 ($0.3851), MA-50 ($0.5093), and MA-200 ($0.8448), which confirms persistent bearish pressure across all key periods.
Highlights
- LDO trades at $0.3432, remaining below MA-20 ($0.3851), MA-50 ($0.5093), and MA-200 ($0.8448), confirming ongoing bearish trends across all timeframes.
- Momentum indicators signal pronounced weakness: daily MACD shows a strong sell, ADX indicates a strong downward trend, and RSI (34.21) along with CCI (-60.95) are oversold.
- Key levels to monitor are resistance at $0.4144 (Ichimoku Kijun) and downside support at $0.3080, with a likely consolidation range between $0.3080 and $0.3780 over the next five days.
Oversold signals and downward momentum sustain weekly technical weakness
Technical analysis on the weekly (W1) timeframe highlights that LDO remains below its primary moving averages, reflecting continued short-, medium-, and long-term bearish trends. The Ichimoku Kijun marks the closest resistance at $0.4144, while the current price is situated just above local support. Weekly RSI is firmly in oversold territory, at 34.21, and momentum indicators such as the MACD and ADX confirm that sellers retain dominance, with downward momentum persisting throughout the week.
Sideways consolidation likely as bearish cues limit rally prospects this week
For the upcoming 5–7 trading days, LDO is expected to consolidate sideways within the $0.3080 to $0.3780 range. The probability of a rally is under 20%, with technical signals still unanimously bearish on the weekly timeframe. A breakout above $0.4144 could spark a bullish scenario, but continued weakness looks more likely; a break below $0.3080 may accelerate declines if bearish momentum persists.
Previously it was reported that Lido continues to trade well below its key moving averages, with persistent downside pressure evidenced by bearish momentum indicators such as MACD, high ADX, and a near-oversold RSI. The asset faces limited recovery prospects as it struggles below all major trend benchmarks and dynamic resistance at the Ichimoku Kijun, keeping risks on the downside with a sideways to lower trajectory expected in the near term.


Latest Lido News


-
 Afghanistan
-
 Albania
-
 Algeria
-
 Angola
-
 Argentina
-
 Armenia
-
 Australia
-
 Austria
-
 Azerbaijan
-
 Bahamas
-
 Bahrain
-
 Bangladesh
-
 Belarus
-
 Belgium
-
 Bolivia
-
 Botswana
-
 Brazil
-
 Brunei
-
 Bulgaria
-
 Cambodia
-
 Cameroon
-
 Canada
-
 Chile
Chile
-
 China
China
-
 Colombia
-
 Congo
Congo
-
 Costa Rica
-
 Cote d'Ivoire
-
 Croatia
-
 Cuba
Cuba
-
 Cyprus
-
 Czechia
-
 DR Congo
-
 Denmark
-
 Dominican Republic
-
 Ecuador
-
 Egypt
Egypt
-
 El Salvador
-
 Estonia
-
 Eswatini
-
 Ethiopia
-
 Finland
-
 France
-
 Georgia
-
 Germany
-
 Ghana
Ghana
-
 Greece
-
 Haiti
Haiti
-
 Hong Kong
-
 Hungary
-
 India
India
-
 Indonesia
-
 Iran, Islamic republic
-
 Iraq
Iraq
-
 Ireland
-
 Israel
-
 Italy
Italy
-
 Jamaica
-
 Japan
Japan
-
 Jordan
-
 Kazakhstan
-
 Kenya
Kenya
-
 Korea
Korea
-
 Kuwait
-
 Kyrgyzstan
-
 Laos
Laos
-
 Latvia
-
 Lebanon
-
 Lesotho
-
 Libya
Libya
-
 Lithuania
-
 Luxembourg
-
 Madagascar
-
 Malaysia
-
 Malta
Malta
-
 Mauritius
-
 Mexico
-
 Moldova
-
 Mongolia
-
 Montenegro
-
 Morocco
-
 Mozambique
-
 Myanmar
-
 Namibia
-
 Nepal
Nepal
-
 Netherlands
-
 New Zealand
-
 Nigeria
-
 North Macedonia
-
 Norway
-
 Oman
Oman
-
 Pakistan
-
 Palestine
-
 Panama
-
 Papua New Guinea
-
 Paraguay
-
 Peru
Peru
-
 Philippines
-
 Poland
-
 Portugal
-
 Puerto Rico
-
 Qatar
Qatar
-
 Reunion
-
 Romania
-
 Rwanda
-
 Saudi Arabia
-
 Serbia
-
 Singapore
-
 Slovakia
-
 Slovenia
-
 Somalia
-
 South Africa
-
 Spain
Spain
-
 Sri Lanka
-
 Sweden
-
 Switzerland
-
 Syria
Syria
-
 Taiwan
-
 Tajikistan
-
 Tanzania
-
 Thailand
-
 Trinidad and Tobago
-
 Tunisia
-
 Turkey
-
 UAE
UAE
-
 Uganda
-
 Ukraine
-
 United Kingdom
-
United States
-
 Uruguay
-
 Uzbekistan
-
 Venezuela
-
 Vietnam
-
 Yemen
Yemen
-
 Zambia
-
 Zimbabwe
- Forex
- Crypto
