
Bearish technicals and strong resistance cap rally — Ethena slips 7.24%

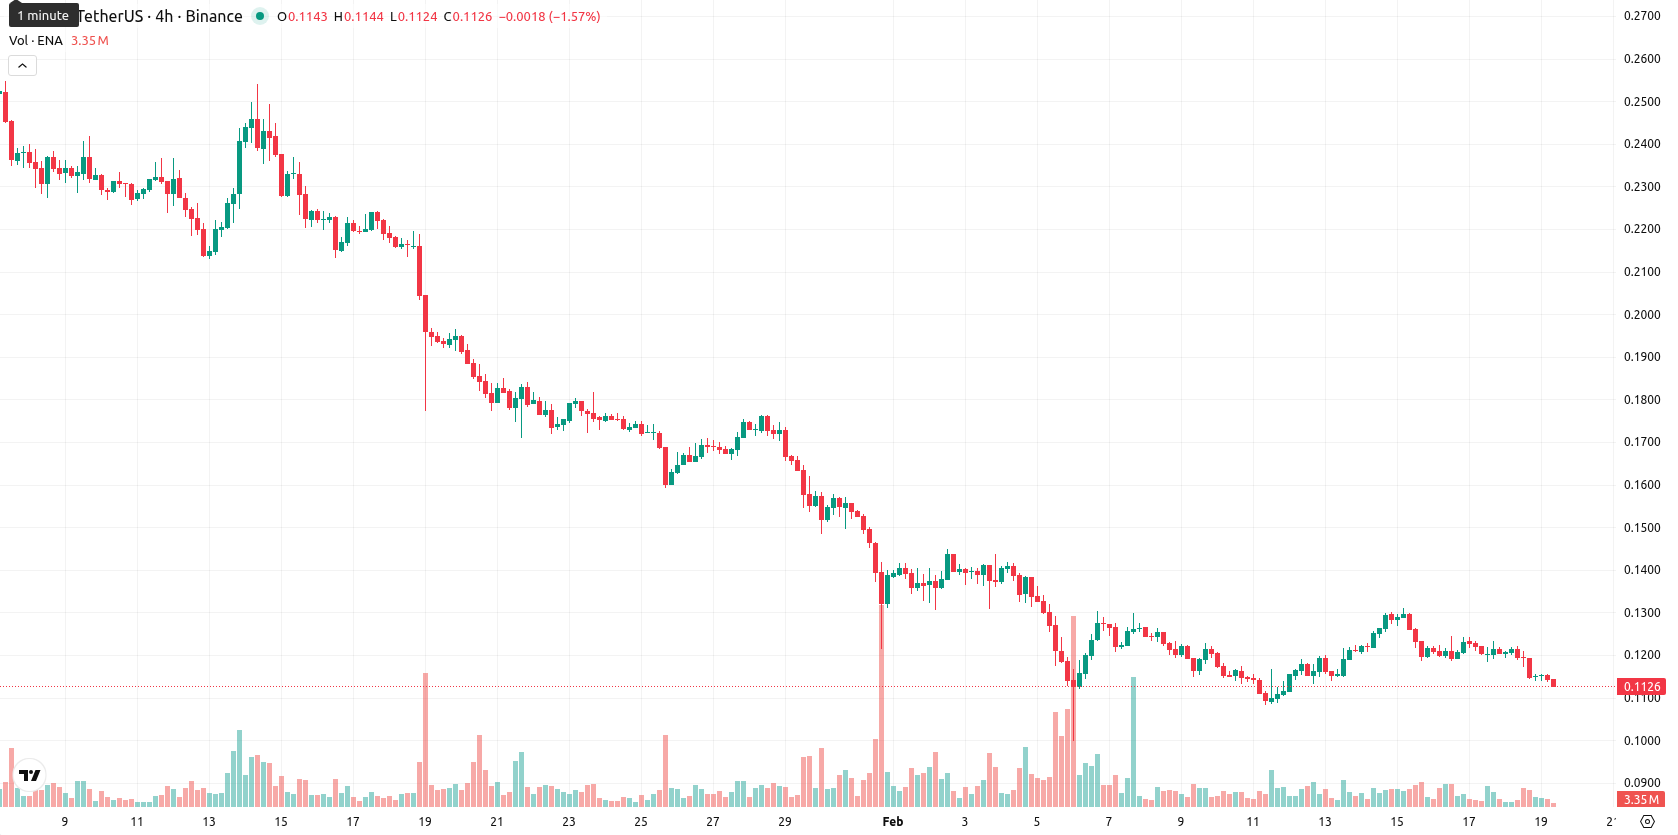
Ethena (ENA) is trading at $0.1128 after slipping 7.24% intraday. The asset remains below the MA-20 ($0.1261), MA-50 ($0.1762), and MA-200 ($0.3990), signaling pronounced downtrends and significant seller pressure across all timeframes.
Highlights
- ENA trades at $0.1128, below its MA-20 ($0.1261), MA-50 ($0.1762), and MA-200 ($0.3990), signaling entrenched downtrends across all timeframes.
- Daily MACD and ADX (42.8) confirm strong bearish momentum, with RSI (33.1) and CCI (-72.6) near oversold, indicating persistent seller dominance.
- The short-term price range is projected at $0.102–$0.124 with downside risk above 80%, and a break above the Ichimoku Kijun at $0.1383 is needed for recovery.
Bearish momentum persists with resistance holding and volatility elevated
Technical analysis shows that ENA faces strong resistance at the Ichimoku Kijun level of $0.1383, with no significant nearby support from Ichimoku or moving averages. Momentum is decisively bearish — the daily MACD confirms a strong sell, ADX is high at 42.8, and both RSI (33.1) and CCI (-72.6) hover near oversold territory. Stochastic RSI is generally neutral but turns oversold on most intraday charts, indicating that downside pressure could be nearing exhaustion, although Bull/Bear Power remains negative and sellers dominate. ENA opened with a modest downward gap and has stayed near the session’s lows amid elevated intraday volatility.
Further declines likely as weak indicators drive trading range
In the short term, ENA is expected to trade within a volatility band relative to current levels, projected between $0.102 and $0.124 for the next five sessions. The probability of further declines is very high (over 80%) due to persistent bearish signals from all major weekly indicators. The baseline scenario sees ongoing sideways consolidation at depressed levels, while recovery would require a decisive break above the $0.1383 Kijun threshold; renewed selling could drive the price toward fresh lows if downside momentum accelerates.
Previously it was reported that Ethena remains under strong selling pressure, trading well below its key moving averages across all timeframes, with downside momentum confirmed by negative MACD and ADX signals. Oscillator readings remain mixed but mostly bearish, with resistance at the Ichimoku Kijun line and limited support, indicating a low probability of near-term bullish reversal and an increased likelihood of continued consolidation or further declines.


Latest Ethena News


-
 Afghanistan
-
 Albania
-
 Algeria
-
 Angola
-
 Argentina
-
 Armenia
-
 Australia
-
 Austria
-
 Azerbaijan
-
 Bahamas
-
 Bahrain
-
 Bangladesh
-
 Belarus
-
 Belgium
-
 Bolivia
-
 Botswana
-
 Brazil
-
 Brunei
-
 Bulgaria
-
 Cambodia
-
 Cameroon
-
 Canada
-
 Chile
Chile
-
 China
China
-
 Colombia
-
 Congo
Congo
-
 Costa Rica
-
 Cote d'Ivoire
-
 Croatia
-
 Cuba
Cuba
-
 Cyprus
-
 Czechia
-
 DR Congo
-
 Denmark
-
 Dominican Republic
-
 Ecuador
-
 Egypt
Egypt
-
 El Salvador
-
 Estonia
-
 Eswatini
-
 Ethiopia
-
 Finland
-
 France
-
 Georgia
-
 Germany
-
 Ghana
Ghana
-
 Greece
-
 Haiti
Haiti
-
 Hong Kong
-
 Hungary
-
 India
India
-
 Indonesia
-
 Iran, Islamic republic
-
 Iraq
Iraq
-
 Ireland
-
 Israel
-
 Italy
Italy
-
 Jamaica
-
 Japan
Japan
-
 Jordan
-
 Kazakhstan
-
 Kenya
Kenya
-
 Korea
Korea
-
 Kuwait
-
 Kyrgyzstan
-
 Laos
Laos
-
 Latvia
-
 Lebanon
-
 Lesotho
-
 Libya
Libya
-
 Lithuania
-
 Luxembourg
-
 Madagascar
-
 Malaysia
-
 Malta
Malta
-
 Mauritius
-
 Mexico
-
 Moldova
-
 Mongolia
-
 Montenegro
-
 Morocco
-
 Mozambique
-
 Myanmar
-
 Namibia
-
 Nepal
Nepal
-
 Netherlands
-
 New Zealand
-
 Nigeria
-
 North Macedonia
-
 Norway
-
 Oman
Oman
-
 Pakistan
-
 Palestine
-
 Panama
-
 Papua New Guinea
-
 Paraguay
-
 Peru
Peru
-
 Philippines
-
 Poland
-
 Portugal
-
 Puerto Rico
-
 Qatar
Qatar
-
 Reunion
-
 Romania
-
 Rwanda
-
 Saudi Arabia
-
 Serbia
-
 Singapore
-
 Slovakia
-
 Slovenia
-
 Somalia
-
 South Africa
-
 Spain
Spain
-
 Sri Lanka
-
 Sweden
-
 Switzerland
-
 Syria
Syria
-
 Taiwan
-
 Tajikistan
-
 Tanzania
-
 Thailand
-
 Trinidad and Tobago
-
 Tunisia
-
 Turkey
-
 UAE
UAE
-
 Uganda
-
 Ukraine
-
 United Kingdom
-
United States
-
 Uruguay
-
 Uzbekistan
-
 Venezuela
-
 Vietnam
-
 Yemen
Yemen
-
 Zambia
-
 Zimbabwe
- Forex
- Crypto
