
XRP price prediction: More volatility ahead as XRP struggles below key averages

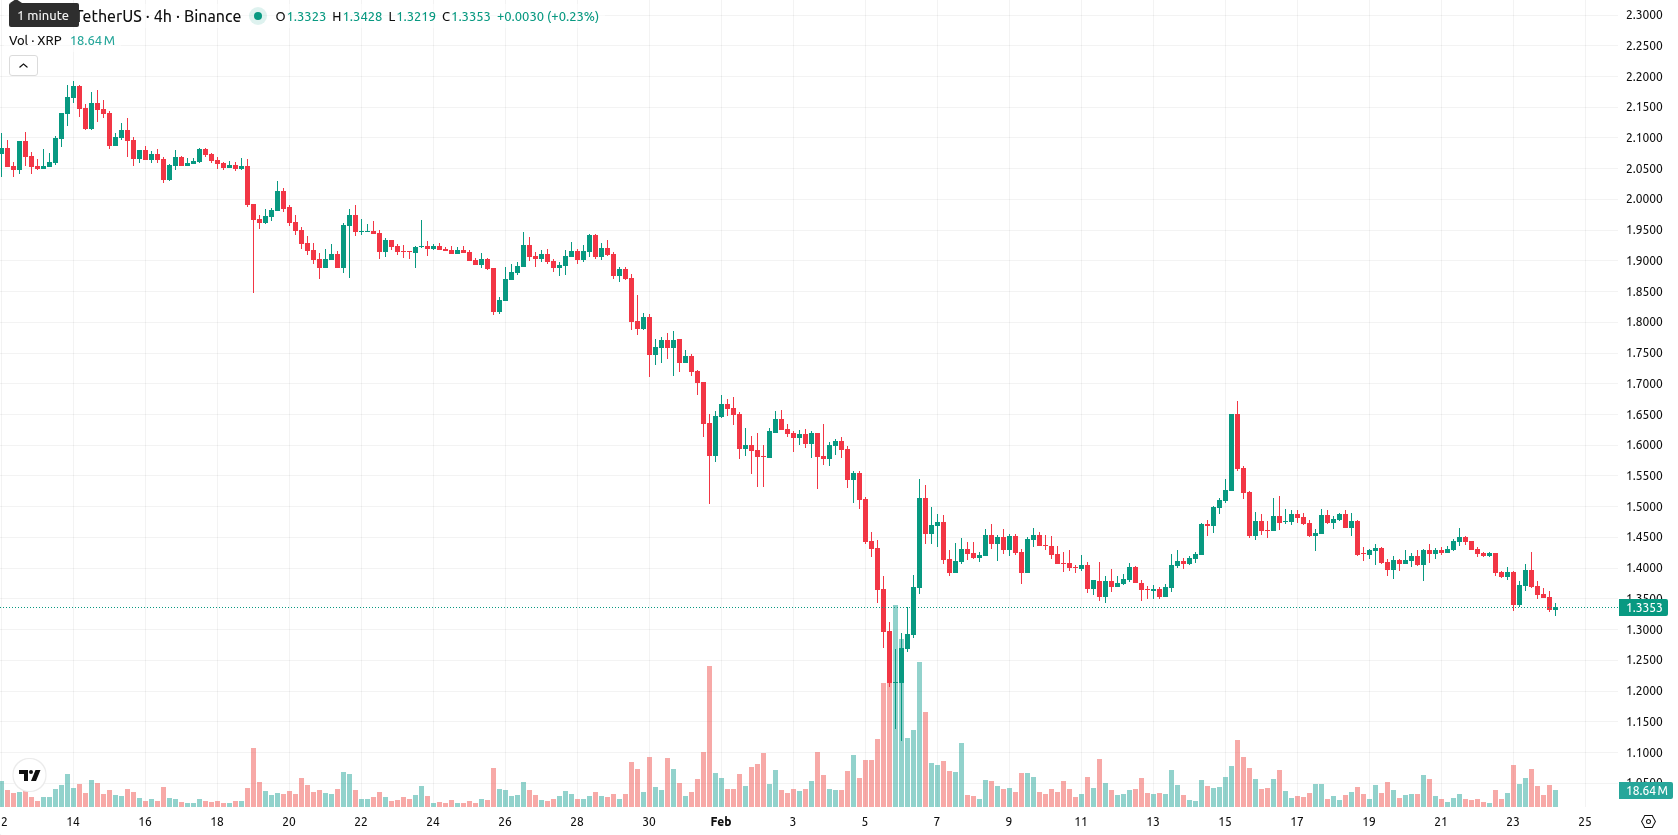
XRP (XRP) is trading well below its MA-20 ($1.4206), MA-50 ($1,7460), and MA-200 ($2.3226), reflecting persistent daily downside, with price near today’s low and a session drop of 1.49%. The Ichimoku Kijun at $1.5153 serves as immediate resistance, underscoring severe selling pressure across all observed timeframes.
Highlights
- SBI Ripple Asia and the Asia Web3 Alliance Japan signed an agreement on February 20, 2026, to support XRP-backed bonds and the XRP Ledger’s real-world adoption.
- Ripple’s legal battle with the U.S. SEC has ended, clearing the way for new XRP partnerships and $3.5 million in institutional investment inflows last week.
- XRP trades firmly below its MA-20 ($1.4206), MA-50 ($1.7460), and MA-200 ($2.3226), with strong bearish momentum and key support at $1.20.
Institutional inflows and new partnerships as legal barriers lift
SBI Ripple Asia and the Asia Web3 Alliance Japan signed a memorandum of understanding on February 20, 2026, to drive the issuance of XRP-backed bonds and support new real-world uses of the XRP Ledger. Ripple’s legal battle with the U.S. SEC has concluded, permitting the company to seek new partnerships and product launches for XRP unimpeded. Last week, XRP investment products saw $3.5 million in capital inflows amid institutional interest and ongoing market volatility, with divergent trends between spot ETFs and the Grayscale Trust.
Bearish momentum and resistance dominance amid mixed signals
XRP’s technical outlook is decisively bearish, with the asset trading well below its short-, medium-, and long-term moving averages and encountering overhead resistance at the Ichimoku Kijun ($1.5153). On daily and weekly timeframes, the MACD and ADX indicate strong downside momentum, while the RSI highlights continued weakness without confirming a true oversold state. Stochastic RSI and CCI convey a mixture of neutral and oversold conditions, and Bull/Bear Power remains negative, confirming dominance by sellers in the intraday session. The Awesome Oscillator does not confirm the prevailing trend, and oscillator divergence points to some hesitation, but the broader momentum and price action remain clearly bearish.
High downside risk as volatility persists within defined range
Looking ahead to the coming week, XRP is expected to remain in a volatility band between $1.20 and $1.45, consistent with recent movements. There is a very high likelihood (over 80%) of further downside, while any upward shift would require a decisive break above $1.52, the Ichimoku Kijun threshold. Barring a move higher, a sideways consolidation within the $1.20 to $1.45 range is the baseline scenario, but a drop below $1.20 would open the door for deeper losses.
Previously it was reported that XRP remains confined within a narrow range near key support and resistance levels, with traders focused on regulatory developments as the primary near-term catalyst. Technical signals point to indecision as price action oscillates between the high-$1.30s and mid-$1.40s, suggesting a tactical market dominated by range trading while major trend confirmation remains elusive.


-
 Afghanistan
-
 Albania
-
 Algeria
-
 Angola
-
 Argentina
-
 Armenia
-
 Australia
-
 Austria
-
 Azerbaijan
-
 Bahamas
-
 Bahrain
-
 Bangladesh
-
 Belarus
-
 Belgium
-
 Bolivia
-
 Botswana
-
 Brazil
-
 Brunei
-
 Bulgaria
-
 Cambodia
-
 Cameroon
-
 Canada
-
 Chile
Chile
-
 China
China
-
 Colombia
-
 Congo
Congo
-
 Costa Rica
-
 Cote d'Ivoire
-
 Croatia
-
 Cuba
Cuba
-
 Cyprus
-
 Czechia
-
 DR Congo
-
 Denmark
-
 Dominican Republic
-
 Ecuador
-
 Egypt
Egypt
-
 El Salvador
-
 Estonia
-
 Eswatini
-
 Ethiopia
-
 Finland
-
 France
-
 Georgia
-
 Germany
-
 Ghana
Ghana
-
 Greece
-
 Haiti
Haiti
-
 Hong Kong
-
 Hungary
-
 India
India
-
 Indonesia
-
 Iran, Islamic republic
-
 Iraq
Iraq
-
 Ireland
-
 Israel
-
 Italy
Italy
-
 Jamaica
-
 Japan
Japan
-
 Jordan
-
 Kazakhstan
-
 Kenya
Kenya
-
 Korea
Korea
-
 Kuwait
-
 Kyrgyzstan
-
 Laos
Laos
-
 Latvia
-
 Lebanon
-
 Lesotho
-
 Libya
Libya
-
 Lithuania
-
 Luxembourg
-
 Madagascar
-
 Malaysia
-
 Malta
Malta
-
 Mauritius
-
 Mexico
-
 Moldova
-
 Mongolia
-
 Montenegro
-
 Morocco
-
 Mozambique
-
 Myanmar
-
 Namibia
-
 Nepal
Nepal
-
 Netherlands
-
 New Zealand
-
 Nigeria
-
 North Macedonia
-
 Norway
-
 Oman
Oman
-
 Pakistan
-
 Palestine
-
 Panama
-
 Papua New Guinea
-
 Paraguay
-
 Peru
Peru
-
 Philippines
-
 Poland
-
 Portugal
-
 Puerto Rico
-
 Qatar
Qatar
-
 Reunion
-
 Romania
-
 Rwanda
-
 Saudi Arabia
-
 Serbia
-
 Singapore
-
 Slovakia
-
 Slovenia
-
 Somalia
-
 South Africa
-
 Spain
Spain
-
 Sri Lanka
-
 Sweden
-
 Switzerland
-
 Syria
Syria
-
 Taiwan
-
 Tajikistan
-
 Tanzania
-
 Thailand
-
 Trinidad and Tobago
-
 Tunisia
-
 Turkey
-
 UAE
UAE
-
 Uganda
-
 Ukraine
-
 United Kingdom
-
United States
-
 Uruguay
-
 Uzbekistan
-
 Venezuela
-
 Vietnam
-
 Yemen
Yemen
-
 Zambia
-
 Zimbabwe
- Forex
- Crypto
